Immigrants from Indonesia vs Scotch-Irish Average Family Size
COMPARE
Immigrants from Indonesia
Scotch-Irish
Average Family Size
Average Family Size Comparison
Immigrants from Indonesia
Scotch-Irish
3.27
AVERAGE FAMILY SIZE
93.7/ 100
METRIC RATING
119th/ 347
METRIC RANK
3.11
AVERAGE FAMILY SIZE
0.0/ 100
METRIC RATING
331st/ 347
METRIC RANK
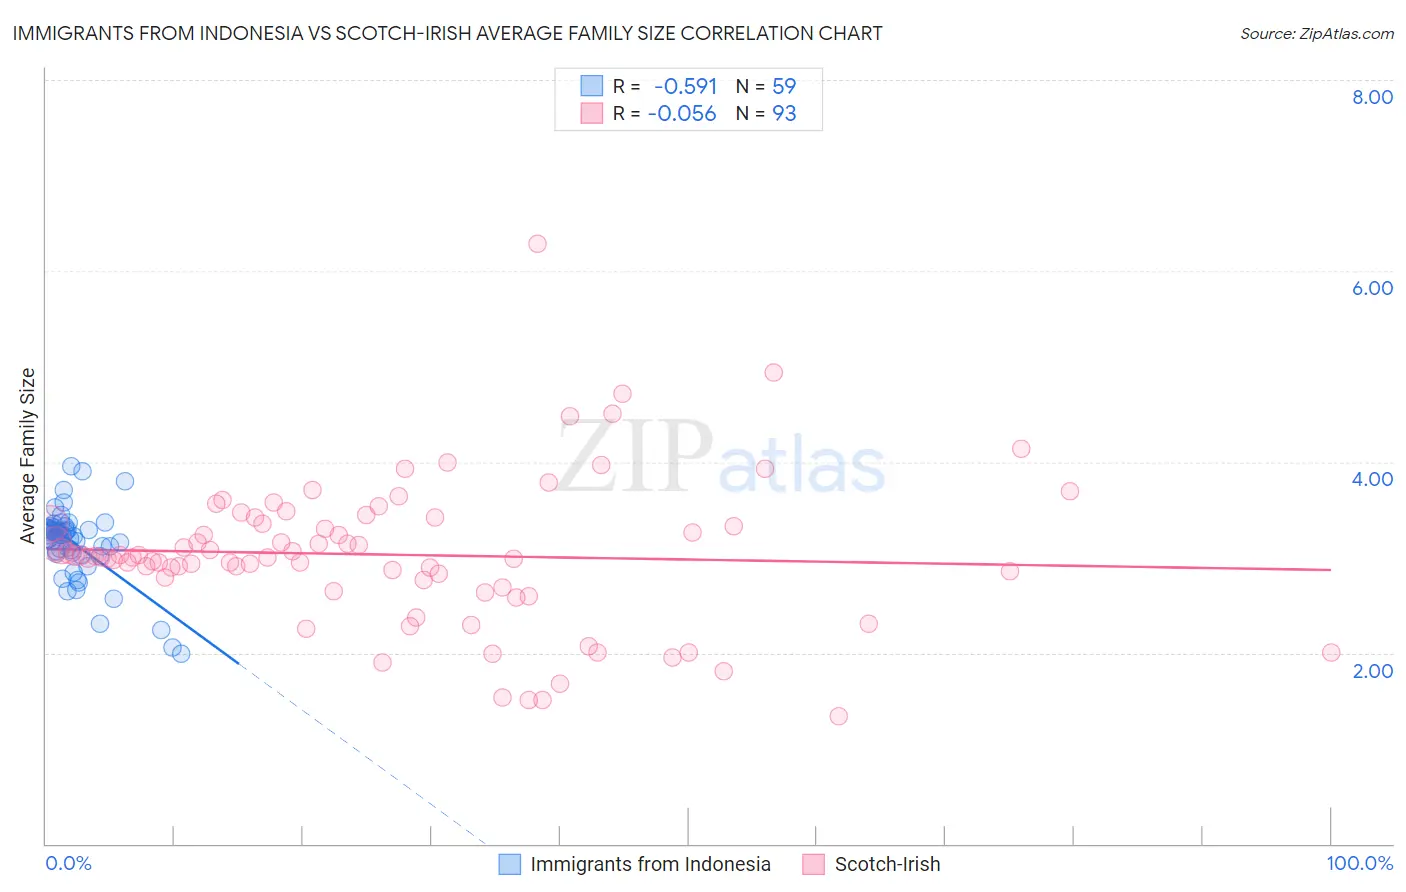
Immigrants from Indonesia vs Scotch-Irish Average Family Size Correlation Chart
The statistical analysis conducted on geographies consisting of 215,720,751 people shows a substantial negative correlation between the proportion of Immigrants from Indonesia and average family size in the United States with a correlation coefficient (R) of -0.591 and weighted average of 3.27. Similarly, the statistical analysis conducted on geographies consisting of 548,372,805 people shows a slight negative correlation between the proportion of Scotch-Irish and average family size in the United States with a correlation coefficient (R) of -0.056 and weighted average of 3.11, a difference of 5.2%.
Average Family Size Correlation Summary
| Measurement | Immigrants from Indonesia | Scotch-Irish |
| Minimum | 1.99 | 1.34 |
| Maximum | 3.95 | 6.29 |
| Range | 1.96 | 4.95 |
| Mean | 3.14 | 3.03 |
| Median | 3.24 | 3.00 |
| Interquartile 25% (IQ1) | 3.04 | 2.73 |
| Interquartile 75% (IQ3) | 3.31 | 3.38 |
| Interquartile Range (IQR) | 0.27 | 0.65 |
| Standard Deviation (Sample) | 0.38 | 0.77 |
| Standard Deviation (Population) | 0.38 | 0.77 |
Similar Demographics by Average Family Size
Demographics Similar to Immigrants from Indonesia by Average Family Size
In terms of average family size, the demographic groups most similar to Immigrants from Indonesia are Immigrants from Bahamas (3.27, a difference of 0.010%), Immigrants from Asia (3.27, a difference of 0.020%), Immigrants from Thailand (3.27, a difference of 0.040%), Immigrants from Colombia (3.27, a difference of 0.070%), and Kiowa (3.27, a difference of 0.090%).
| Demographics | Rating | Rank | Average Family Size |
| Blacks/African Americans | 95.7 /100 | #112 | Exceptional 3.27 |
| Immigrants | Panama | 95.6 /100 | #113 | Exceptional 3.27 |
| South Americans | 95.1 /100 | #114 | Exceptional 3.27 |
| Immigrants | Liberia | 95.0 /100 | #115 | Exceptional 3.27 |
| Immigrants | South America | 95.0 /100 | #116 | Exceptional 3.27 |
| Kiowa | 94.8 /100 | #117 | Exceptional 3.27 |
| Immigrants | Asia | 94.0 /100 | #118 | Exceptional 3.27 |
| Immigrants | Indonesia | 93.7 /100 | #119 | Exceptional 3.27 |
| Immigrants | Bahamas | 93.6 /100 | #120 | Exceptional 3.27 |
| Immigrants | Thailand | 93.3 /100 | #121 | Exceptional 3.27 |
| Immigrants | Colombia | 92.8 /100 | #122 | Exceptional 3.27 |
| Alaskan Athabascans | 92.4 /100 | #123 | Exceptional 3.27 |
| South American Indians | 91.6 /100 | #124 | Exceptional 3.26 |
| Immigrants | Cuba | 91.3 /100 | #125 | Exceptional 3.26 |
| Immigrants | Costa Rica | 90.7 /100 | #126 | Exceptional 3.26 |
Demographics Similar to Scotch-Irish by Average Family Size
In terms of average family size, the demographic groups most similar to Scotch-Irish are Latvian (3.11, a difference of 0.0%), Scottish (3.11, a difference of 0.0%), Estonian (3.10, a difference of 0.050%), Lithuanian (3.10, a difference of 0.050%), and Belgian (3.11, a difference of 0.060%).
| Demographics | Rating | Rank | Average Family Size |
| Celtics | 0.0 /100 | #324 | Tragic 3.11 |
| English | 0.0 /100 | #325 | Tragic 3.11 |
| Ottawa | 0.0 /100 | #326 | Tragic 3.11 |
| Dutch | 0.0 /100 | #327 | Tragic 3.11 |
| Czechs | 0.0 /100 | #328 | Tragic 3.11 |
| Belgians | 0.0 /100 | #329 | Tragic 3.11 |
| Latvians | 0.0 /100 | #330 | Tragic 3.11 |
| Scotch-Irish | 0.0 /100 | #331 | Tragic 3.11 |
| Scottish | 0.0 /100 | #332 | Tragic 3.11 |
| Estonians | 0.0 /100 | #333 | Tragic 3.10 |
| Lithuanians | 0.0 /100 | #334 | Tragic 3.10 |
| Luxembourgers | 0.0 /100 | #335 | Tragic 3.10 |
| Irish | 0.0 /100 | #336 | Tragic 3.10 |
| Swedes | 0.0 /100 | #337 | Tragic 3.10 |
| French | 0.0 /100 | #338 | Tragic 3.10 |