Immigrants from Northern Europe vs Immigrants from Burma/Myanmar Single Mother Households
COMPARE
Immigrants from Northern Europe
Immigrants from Burma/Myanmar
Single Mother Households
Single Mother Households Comparison
Immigrants from Northern Europe
Immigrants from Burma/Myanmar
5.3%
SINGLE MOTHER HOUSEHOLDS
99.7/ 100
METRIC RATING
35th/ 347
METRIC RANK
7.0%
SINGLE MOTHER HOUSEHOLDS
1.4/ 100
METRIC RATING
235th/ 347
METRIC RANK
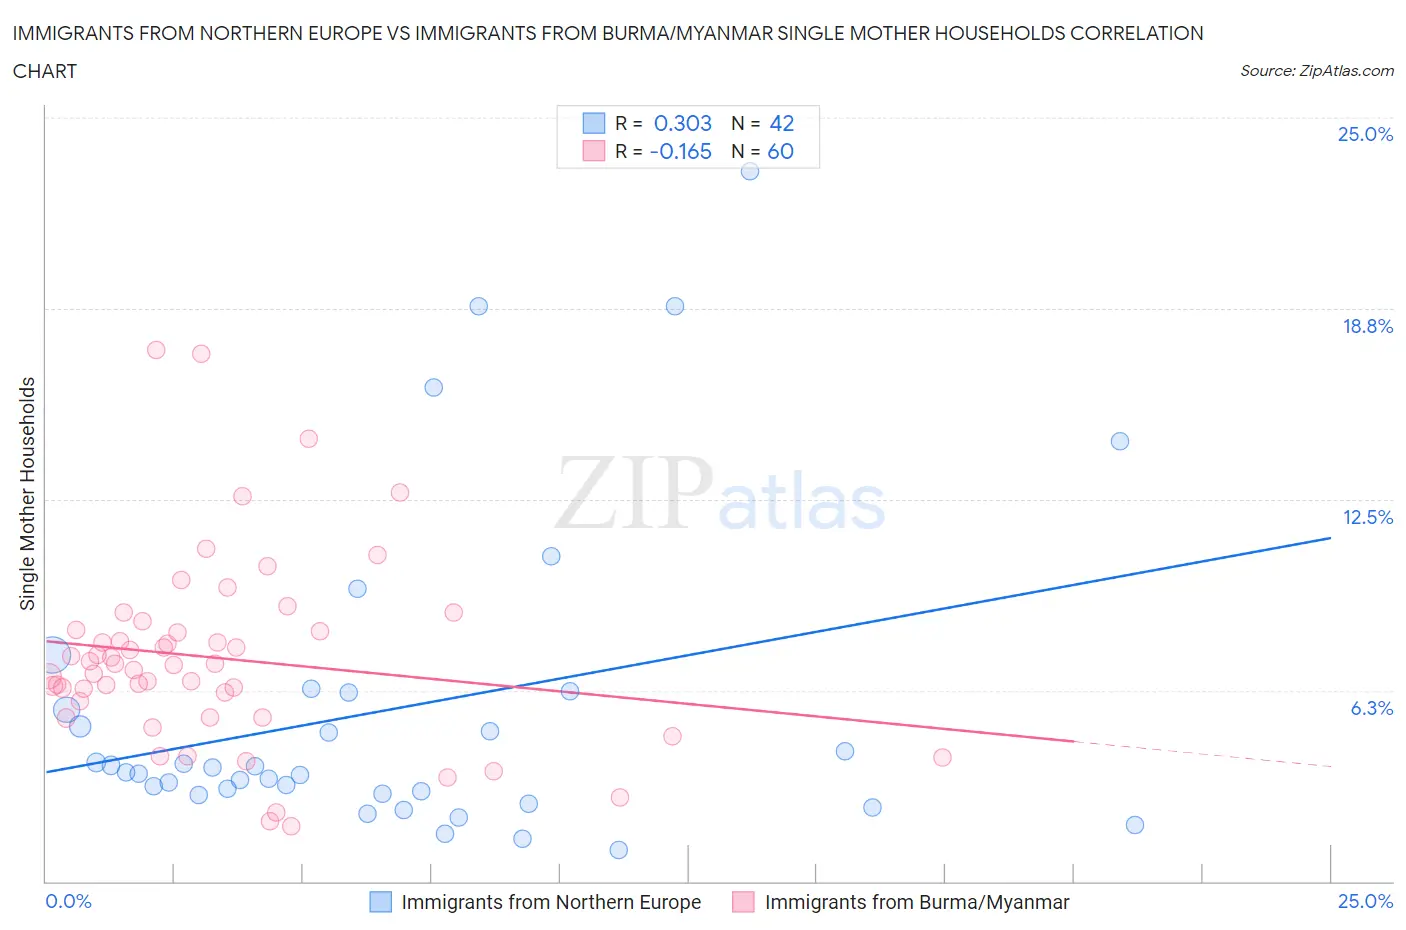
Immigrants from Northern Europe vs Immigrants from Burma/Myanmar Single Mother Households Correlation Chart
The statistical analysis conducted on geographies consisting of 474,819,920 people shows a mild positive correlation between the proportion of Immigrants from Northern Europe and percentage of single mother households in the United States with a correlation coefficient (R) of 0.303 and weighted average of 5.3%. Similarly, the statistical analysis conducted on geographies consisting of 172,110,214 people shows a poor negative correlation between the proportion of Immigrants from Burma/Myanmar and percentage of single mother households in the United States with a correlation coefficient (R) of -0.165 and weighted average of 7.0%, a difference of 32.7%.
Single Mother Households Correlation Summary
| Measurement | Immigrants from Northern Europe | Immigrants from Burma/Myanmar |
| Minimum | 1.0% | 1.8% |
| Maximum | 23.2% | 17.4% |
| Range | 22.2% | 15.6% |
| Mean | 5.6% | 7.3% |
| Median | 3.6% | 7.1% |
| Interquartile 25% (IQ1) | 2.9% | 5.6% |
| Interquartile 75% (IQ3) | 6.2% | 8.2% |
| Interquartile Range (IQR) | 3.3% | 2.6% |
| Standard Deviation (Sample) | 5.2% | 3.1% |
| Standard Deviation (Population) | 5.1% | 3.1% |
Similar Demographics by Single Mother Households
Demographics Similar to Immigrants from Northern Europe by Single Mother Households
In terms of single mother households, the demographic groups most similar to Immigrants from Northern Europe are Bulgarian (5.3%, a difference of 0.040%), Immigrants from Switzerland (5.3%, a difference of 0.060%), Immigrants from Czechoslovakia (5.3%, a difference of 0.20%), Immigrants from Belgium (5.3%, a difference of 0.35%), and Cambodian (5.3%, a difference of 0.44%).
| Demographics | Rating | Rank | Single Mother Households |
| Russians | 99.7 /100 | #28 | Exceptional 5.3% |
| Latvians | 99.7 /100 | #29 | Exceptional 5.3% |
| Burmese | 99.7 /100 | #30 | Exceptional 5.3% |
| Immigrants | Korea | 99.7 /100 | #31 | Exceptional 5.3% |
| Cambodians | 99.7 /100 | #32 | Exceptional 5.3% |
| Immigrants | Switzerland | 99.7 /100 | #33 | Exceptional 5.3% |
| Bulgarians | 99.7 /100 | #34 | Exceptional 5.3% |
| Immigrants | Northern Europe | 99.7 /100 | #35 | Exceptional 5.3% |
| Immigrants | Czechoslovakia | 99.7 /100 | #36 | Exceptional 5.3% |
| Immigrants | Belgium | 99.7 /100 | #37 | Exceptional 5.3% |
| Immigrants | Serbia | 99.6 /100 | #38 | Exceptional 5.4% |
| Immigrants | Sweden | 99.6 /100 | #39 | Exceptional 5.4% |
| Estonians | 99.6 /100 | #40 | Exceptional 5.4% |
| Immigrants | Greece | 99.5 /100 | #41 | Exceptional 5.4% |
| Macedonians | 99.5 /100 | #42 | Exceptional 5.4% |
Demographics Similar to Immigrants from Burma/Myanmar by Single Mother Households
In terms of single mother households, the demographic groups most similar to Immigrants from Burma/Myanmar are Chickasaw (7.0%, a difference of 0.070%), Choctaw (7.0%, a difference of 0.090%), Comanche (7.0%, a difference of 0.26%), Spanish American (7.0%, a difference of 0.32%), and Creek (7.0%, a difference of 0.34%).
| Demographics | Rating | Rank | Single Mother Households |
| Iroquois | 2.2 /100 | #228 | Tragic 7.0% |
| Immigrants | Kenya | 2.1 /100 | #229 | Tragic 7.0% |
| Creek | 1.6 /100 | #230 | Tragic 7.0% |
| Spanish Americans | 1.6 /100 | #231 | Tragic 7.0% |
| Comanche | 1.5 /100 | #232 | Tragic 7.0% |
| Choctaw | 1.4 /100 | #233 | Tragic 7.0% |
| Chickasaw | 1.4 /100 | #234 | Tragic 7.0% |
| Immigrants | Burma/Myanmar | 1.4 /100 | #235 | Tragic 7.0% |
| Ute | 1.0 /100 | #236 | Tragic 7.1% |
| Arapaho | 1.0 /100 | #237 | Tragic 7.1% |
| Panamanians | 0.9 /100 | #238 | Tragic 7.1% |
| Kiowa | 0.8 /100 | #239 | Tragic 7.1% |
| Immigrants | Panama | 0.7 /100 | #240 | Tragic 7.2% |
| Immigrants | Portugal | 0.6 /100 | #241 | Tragic 7.2% |
| Fijians | 0.6 /100 | #242 | Tragic 7.2% |