Immigrants from Peru vs Immigrants from Burma/Myanmar Single Mother Households
COMPARE
Immigrants from Peru
Immigrants from Burma/Myanmar
Single Mother Households
Single Mother Households Comparison
Immigrants from Peru
Immigrants from Burma/Myanmar
6.7%
SINGLE MOTHER HOUSEHOLDS
12.0/ 100
METRIC RATING
203rd/ 347
METRIC RANK
7.0%
SINGLE MOTHER HOUSEHOLDS
1.4/ 100
METRIC RATING
235th/ 347
METRIC RANK
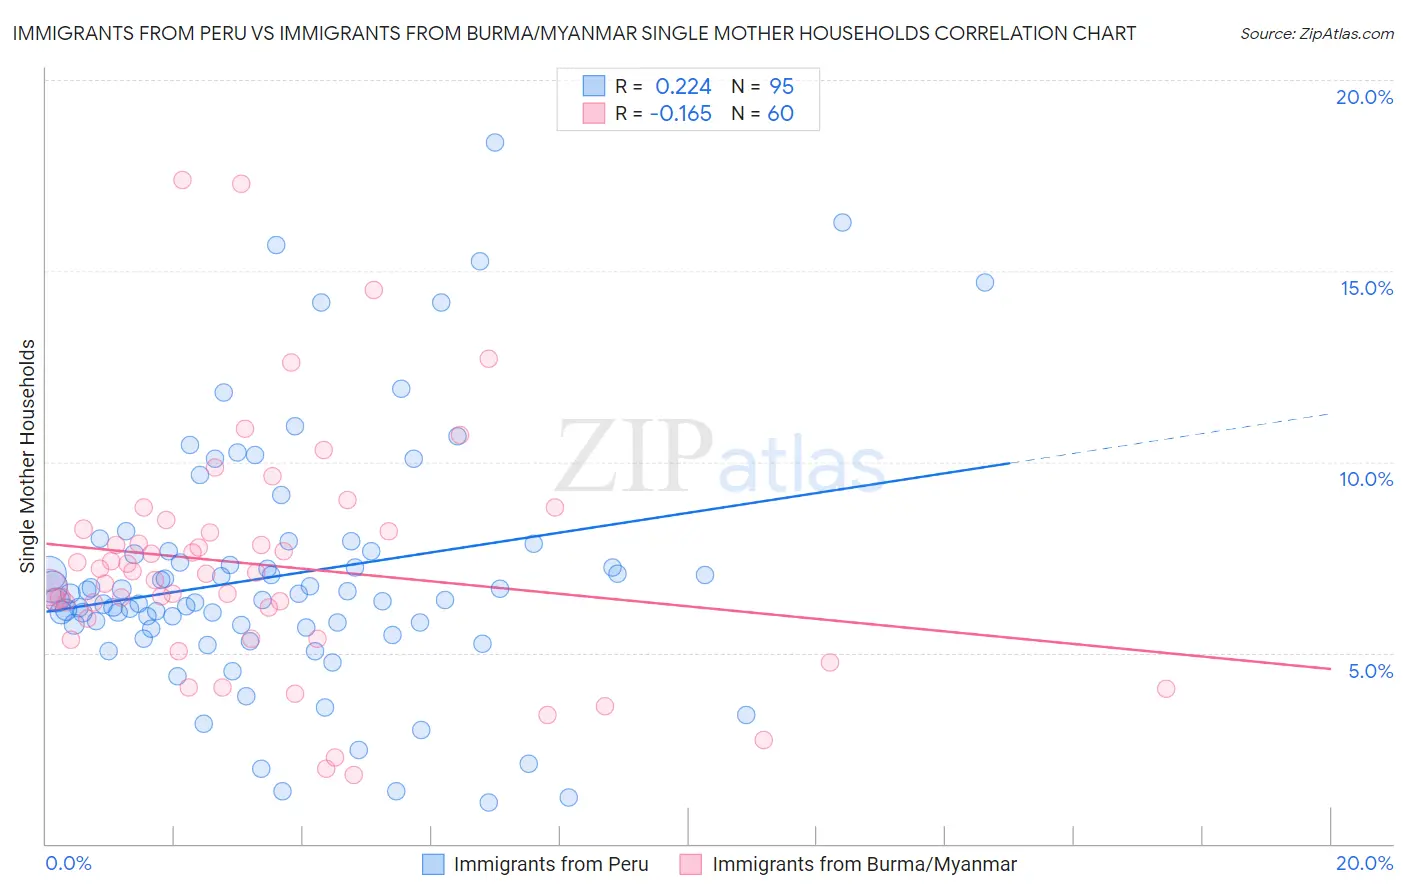
Immigrants from Peru vs Immigrants from Burma/Myanmar Single Mother Households Correlation Chart
The statistical analysis conducted on geographies consisting of 328,227,013 people shows a weak positive correlation between the proportion of Immigrants from Peru and percentage of single mother households in the United States with a correlation coefficient (R) of 0.224 and weighted average of 6.7%. Similarly, the statistical analysis conducted on geographies consisting of 172,110,214 people shows a poor negative correlation between the proportion of Immigrants from Burma/Myanmar and percentage of single mother households in the United States with a correlation coefficient (R) of -0.165 and weighted average of 7.0%, a difference of 5.9%.
Single Mother Households Correlation Summary
| Measurement | Immigrants from Peru | Immigrants from Burma/Myanmar |
| Minimum | 1.1% | 1.8% |
| Maximum | 18.4% | 17.4% |
| Range | 17.3% | 15.6% |
| Mean | 7.0% | 7.3% |
| Median | 6.4% | 7.1% |
| Interquartile 25% (IQ1) | 5.7% | 5.6% |
| Interquartile 75% (IQ3) | 7.7% | 8.2% |
| Interquartile Range (IQR) | 2.0% | 2.6% |
| Standard Deviation (Sample) | 3.3% | 3.1% |
| Standard Deviation (Population) | 3.2% | 3.1% |
Similar Demographics by Single Mother Households
Demographics Similar to Immigrants from Peru by Single Mother Households
In terms of single mother households, the demographic groups most similar to Immigrants from Peru are Immigrants from Fiji (6.7%, a difference of 0.010%), Cree (6.7%, a difference of 0.030%), Guamanian/Chamorro (6.6%, a difference of 0.090%), German Russian (6.7%, a difference of 0.11%), and Immigrants from South America (6.7%, a difference of 0.11%).
| Demographics | Rating | Rank | Single Mother Households |
| Uruguayans | 18.0 /100 | #196 | Poor 6.6% |
| Moroccans | 17.4 /100 | #197 | Poor 6.6% |
| Hawaiians | 16.1 /100 | #198 | Poor 6.6% |
| Potawatomi | 15.5 /100 | #199 | Poor 6.6% |
| Immigrants | Ethiopia | 14.7 /100 | #200 | Poor 6.6% |
| Venezuelans | 12.9 /100 | #201 | Poor 6.6% |
| Guamanians/Chamorros | 12.4 /100 | #202 | Poor 6.6% |
| Immigrants | Peru | 12.0 /100 | #203 | Poor 6.7% |
| Immigrants | Fiji | 11.9 /100 | #204 | Poor 6.7% |
| Cree | 11.9 /100 | #205 | Poor 6.7% |
| German Russians | 11.5 /100 | #206 | Poor 6.7% |
| Immigrants | South America | 11.5 /100 | #207 | Poor 6.7% |
| Vietnamese | 11.3 /100 | #208 | Poor 6.7% |
| Immigrants | Colombia | 10.5 /100 | #209 | Poor 6.7% |
| Immigrants | Nonimmigrants | 10.4 /100 | #210 | Poor 6.7% |
Demographics Similar to Immigrants from Burma/Myanmar by Single Mother Households
In terms of single mother households, the demographic groups most similar to Immigrants from Burma/Myanmar are Chickasaw (7.0%, a difference of 0.070%), Choctaw (7.0%, a difference of 0.090%), Comanche (7.0%, a difference of 0.26%), Spanish American (7.0%, a difference of 0.32%), and Creek (7.0%, a difference of 0.34%).
| Demographics | Rating | Rank | Single Mother Households |
| Iroquois | 2.2 /100 | #228 | Tragic 7.0% |
| Immigrants | Kenya | 2.1 /100 | #229 | Tragic 7.0% |
| Creek | 1.6 /100 | #230 | Tragic 7.0% |
| Spanish Americans | 1.6 /100 | #231 | Tragic 7.0% |
| Comanche | 1.5 /100 | #232 | Tragic 7.0% |
| Choctaw | 1.4 /100 | #233 | Tragic 7.0% |
| Chickasaw | 1.4 /100 | #234 | Tragic 7.0% |
| Immigrants | Burma/Myanmar | 1.4 /100 | #235 | Tragic 7.0% |
| Ute | 1.0 /100 | #236 | Tragic 7.1% |
| Arapaho | 1.0 /100 | #237 | Tragic 7.1% |
| Panamanians | 0.9 /100 | #238 | Tragic 7.1% |
| Kiowa | 0.8 /100 | #239 | Tragic 7.1% |
| Immigrants | Panama | 0.7 /100 | #240 | Tragic 7.2% |
| Immigrants | Portugal | 0.6 /100 | #241 | Tragic 7.2% |
| Fijians | 0.6 /100 | #242 | Tragic 7.2% |