Immigrants from North Macedonia vs Arab College, 1 year or more
COMPARE
Immigrants from North Macedonia
Arab
College, 1 year or more
College, 1 year or more Comparison
Immigrants from North Macedonia
Arabs
59.5%
COLLEGE, 1 YEAR OR MORE
53.1/ 100
METRIC RATING
167th/ 347
METRIC RANK
61.6%
COLLEGE, 1 YEAR OR MORE
93.9/ 100
METRIC RATING
117th/ 347
METRIC RANK
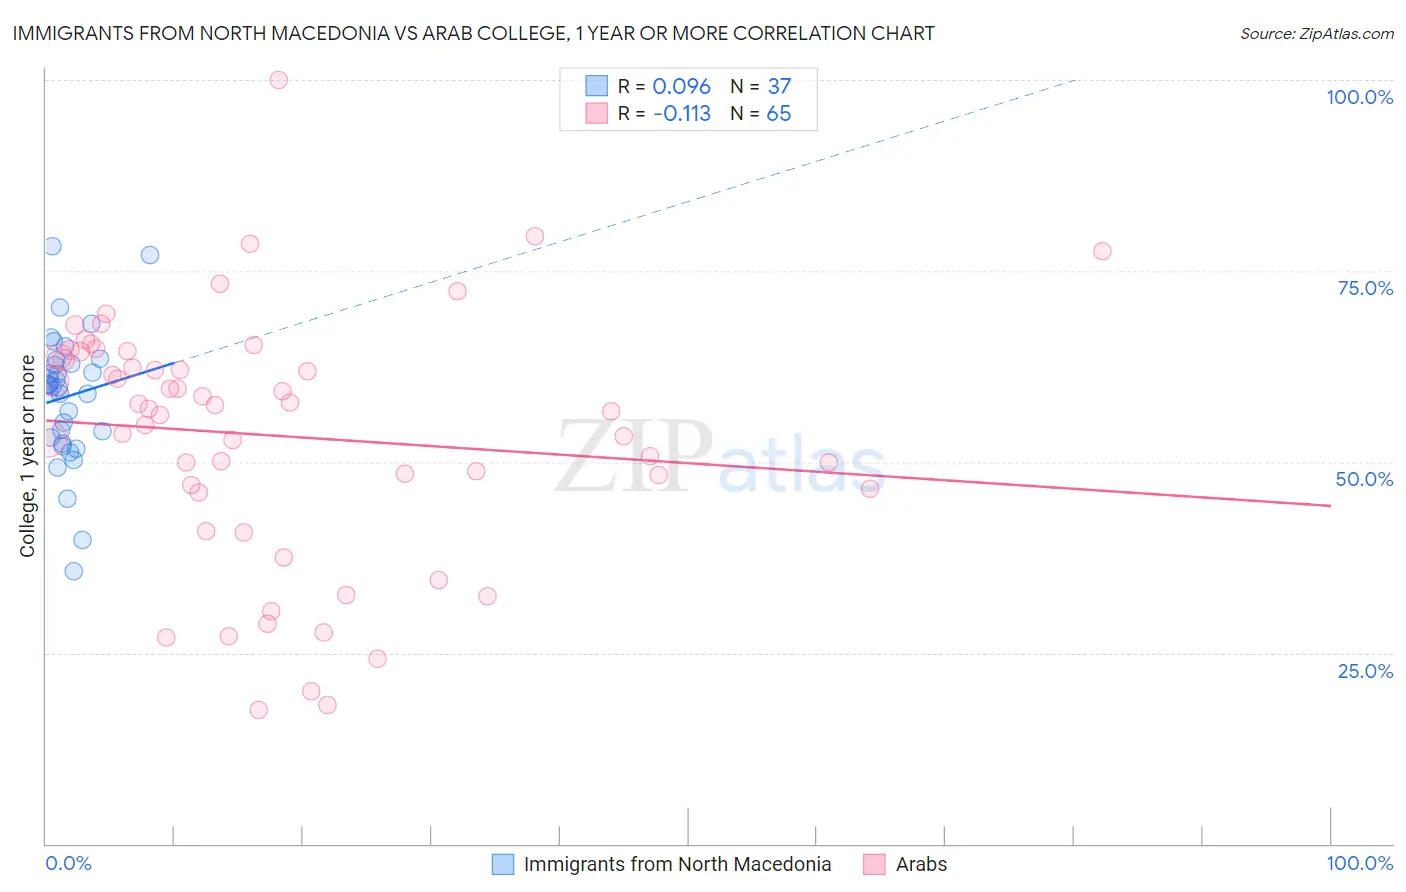
Immigrants from North Macedonia vs Arab College, 1 year or more Correlation Chart
The statistical analysis conducted on geographies consisting of 74,317,045 people shows a slight positive correlation between the proportion of Immigrants from North Macedonia and percentage of population with at least college, 1 year or more education in the United States with a correlation coefficient (R) of 0.096 and weighted average of 59.5%. Similarly, the statistical analysis conducted on geographies consisting of 486,868,588 people shows a poor negative correlation between the proportion of Arabs and percentage of population with at least college, 1 year or more education in the United States with a correlation coefficient (R) of -0.113 and weighted average of 61.6%, a difference of 3.5%.
College, 1 year or more Correlation Summary
| Measurement | Immigrants from North Macedonia | Arab |
| Minimum | 35.6% | 17.6% |
| Maximum | 78.3% | 100.0% |
| Range | 42.7% | 82.4% |
| Mean | 58.6% | 53.4% |
| Median | 59.8% | 57.0% |
| Interquartile 25% (IQ1) | 52.8% | 46.2% |
| Interquartile 75% (IQ3) | 63.0% | 64.1% |
| Interquartile Range (IQR) | 10.2% | 17.9% |
| Standard Deviation (Sample) | 8.7% | 16.3% |
| Standard Deviation (Population) | 8.6% | 16.2% |
Similar Demographics by College, 1 year or more
Demographics Similar to Immigrants from North Macedonia by College, 1 year or more
In terms of college, 1 year or more, the demographic groups most similar to Immigrants from North Macedonia are Hungarian (59.5%, a difference of 0.010%), Immigrants from Southern Europe (59.5%, a difference of 0.020%), Welsh (59.5%, a difference of 0.040%), Immigrants from Albania (59.5%, a difference of 0.040%), and Immigrants from Sierra Leone (59.5%, a difference of 0.050%).
| Demographics | Rating | Rank | College, 1 year or more |
| South American Indians | 66.9 /100 | #160 | Good 60.0% |
| Somalis | 64.5 /100 | #161 | Good 59.9% |
| Koreans | 58.5 /100 | #162 | Average 59.7% |
| Immigrants | Somalia | 58.3 /100 | #163 | Average 59.7% |
| Belgians | 58.1 /100 | #164 | Average 59.7% |
| Irish | 56.1 /100 | #165 | Average 59.6% |
| Immigrants | Africa | 56.1 /100 | #166 | Average 59.6% |
| Immigrants | North Macedonia | 53.1 /100 | #167 | Average 59.5% |
| Hungarians | 52.9 /100 | #168 | Average 59.5% |
| Immigrants | Southern Europe | 52.7 /100 | #169 | Average 59.5% |
| Welsh | 52.4 /100 | #170 | Average 59.5% |
| Immigrants | Albania | 52.3 /100 | #171 | Average 59.5% |
| Immigrants | Sierra Leone | 52.2 /100 | #172 | Average 59.5% |
| Immigrants | Oceania | 51.2 /100 | #173 | Average 59.4% |
| Celtics | 50.0 /100 | #174 | Average 59.4% |
Demographics Similar to Arabs by College, 1 year or more
In terms of college, 1 year or more, the demographic groups most similar to Arabs are Immigrants from Brazil (61.6%, a difference of 0.0%), Lebanese (61.6%, a difference of 0.040%), Norwegian (61.7%, a difference of 0.14%), Assyrian/Chaldean/Syriac (61.5%, a difference of 0.14%), and Pakistani (61.5%, a difference of 0.14%).
| Demographics | Rating | Rank | College, 1 year or more |
| Europeans | 95.6 /100 | #110 | Exceptional 61.8% |
| Macedonians | 95.6 /100 | #111 | Exceptional 61.8% |
| Austrians | 95.4 /100 | #112 | Exceptional 61.8% |
| Ukrainians | 95.2 /100 | #113 | Exceptional 61.8% |
| Danes | 94.8 /100 | #114 | Exceptional 61.7% |
| Norwegians | 94.5 /100 | #115 | Exceptional 61.7% |
| Lebanese | 94.1 /100 | #116 | Exceptional 61.6% |
| Arabs | 93.9 /100 | #117 | Exceptional 61.6% |
| Immigrants | Brazil | 93.9 /100 | #118 | Exceptional 61.6% |
| Assyrians/Chaldeans/Syriacs | 93.3 /100 | #119 | Exceptional 61.5% |
| Pakistanis | 93.2 /100 | #120 | Exceptional 61.5% |
| Immigrants | Jordan | 92.7 /100 | #121 | Exceptional 61.4% |
| Immigrants | Chile | 92.3 /100 | #122 | Exceptional 61.4% |
| Serbians | 92.2 /100 | #123 | Exceptional 61.4% |
| Venezuelans | 92.1 /100 | #124 | Exceptional 61.3% |