French vs German Currently Married
COMPARE
French
German
Currently Married
Currently Married Comparison
French
Germans
48.4%
CURRENTLY MARRIED
98.6/ 100
METRIC RATING
58th/ 347
METRIC RANK
49.6%
CURRENTLY MARRIED
99.9/ 100
METRIC RATING
14th/ 347
METRIC RANK
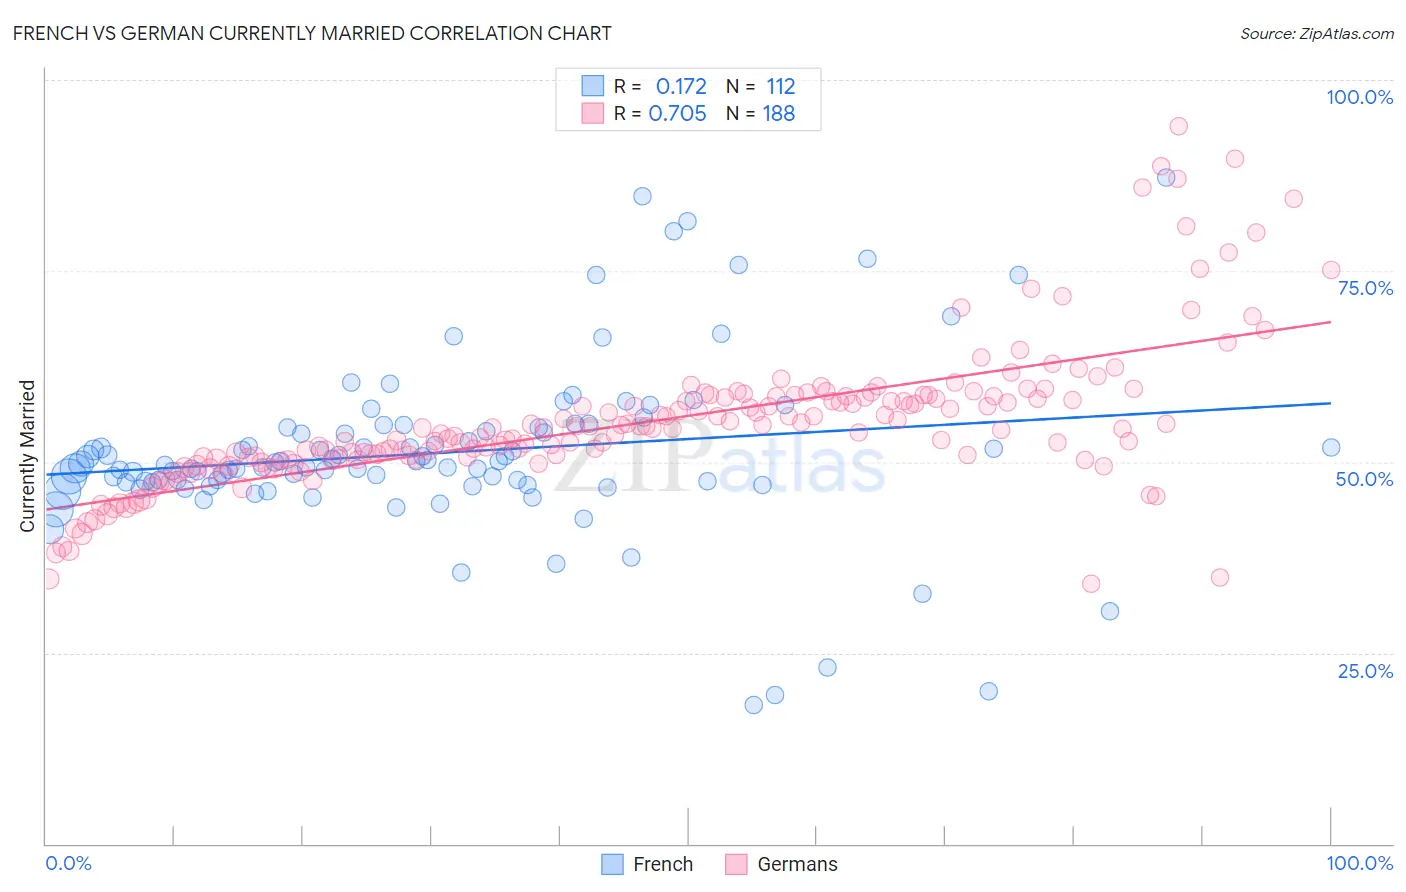
French vs German Currently Married Correlation Chart
The statistical analysis conducted on geographies consisting of 572,298,467 people shows a poor positive correlation between the proportion of French and percentage of population currently married in the United States with a correlation coefficient (R) of 0.172 and weighted average of 48.4%. Similarly, the statistical analysis conducted on geographies consisting of 581,146,100 people shows a strong positive correlation between the proportion of Germans and percentage of population currently married in the United States with a correlation coefficient (R) of 0.705 and weighted average of 49.6%, a difference of 2.4%.
Currently Married Correlation Summary
| Measurement | French | German |
| Minimum | 18.1% | 34.0% |
| Maximum | 87.2% | 93.9% |
| Range | 69.1% | 59.9% |
| Mean | 51.2% | 55.3% |
| Median | 49.6% | 54.4% |
| Interquartile 25% (IQ1) | 47.3% | 50.4% |
| Interquartile 75% (IQ3) | 54.2% | 58.5% |
| Interquartile Range (IQR) | 6.9% | 8.2% |
| Standard Deviation (Sample) | 11.4% | 9.6% |
| Standard Deviation (Population) | 11.3% | 9.5% |
Similar Demographics by Currently Married
Demographics Similar to French by Currently Married
In terms of currently married, the demographic groups most similar to French are Immigrants from Ireland (48.4%, a difference of 0.030%), Immigrants from Netherlands (48.5%, a difference of 0.040%), Immigrants from Romania (48.4%, a difference of 0.040%), Romanian (48.4%, a difference of 0.050%), and Asian (48.4%, a difference of 0.060%).
| Demographics | Rating | Rank | Currently Married |
| Whites/Caucasians | 99.0 /100 | #51 | Exceptional 48.6% |
| Russians | 98.9 /100 | #52 | Exceptional 48.6% |
| Immigrants | Austria | 98.8 /100 | #53 | Exceptional 48.5% |
| Immigrants | Moldova | 98.7 /100 | #54 | Exceptional 48.5% |
| Immigrants | North Macedonia | 98.7 /100 | #55 | Exceptional 48.5% |
| Latvians | 98.7 /100 | #56 | Exceptional 48.5% |
| Immigrants | Netherlands | 98.6 /100 | #57 | Exceptional 48.5% |
| French | 98.6 /100 | #58 | Exceptional 48.4% |
| Immigrants | Ireland | 98.5 /100 | #59 | Exceptional 48.4% |
| Immigrants | Romania | 98.5 /100 | #60 | Exceptional 48.4% |
| Romanians | 98.5 /100 | #61 | Exceptional 48.4% |
| Asians | 98.5 /100 | #62 | Exceptional 48.4% |
| Slavs | 98.3 /100 | #63 | Exceptional 48.4% |
| Immigrants | Czechoslovakia | 98.3 /100 | #64 | Exceptional 48.4% |
| Ukrainians | 98.3 /100 | #65 | Exceptional 48.4% |
Demographics Similar to Germans by Currently Married
In terms of currently married, the demographic groups most similar to Germans are Dutch (49.6%, a difference of 0.010%), Pennsylvania German (49.6%, a difference of 0.030%), Chinese (49.5%, a difference of 0.17%), Scandinavian (49.5%, a difference of 0.19%), and English (49.7%, a difference of 0.28%).
| Demographics | Rating | Rank | Currently Married |
| Immigrants | South Central Asia | 100.0 /100 | #7 | Exceptional 50.0% |
| Swedes | 100.0 /100 | #8 | Exceptional 50.0% |
| Czechs | 99.9 /100 | #9 | Exceptional 49.9% |
| Filipinos | 99.9 /100 | #10 | Exceptional 49.7% |
| English | 99.9 /100 | #11 | Exceptional 49.7% |
| Swiss | 99.9 /100 | #12 | Exceptional 49.7% |
| Dutch | 99.9 /100 | #13 | Exceptional 49.6% |
| Germans | 99.9 /100 | #14 | Exceptional 49.6% |
| Pennsylvania Germans | 99.9 /100 | #15 | Exceptional 49.6% |
| Chinese | 99.9 /100 | #16 | Exceptional 49.5% |
| Scandinavians | 99.9 /100 | #17 | Exceptional 49.5% |
| Immigrants | Scotland | 99.8 /100 | #18 | Exceptional 49.3% |
| Europeans | 99.8 /100 | #19 | Exceptional 49.3% |
| Luxembourgers | 99.8 /100 | #20 | Exceptional 49.3% |
| Scottish | 99.8 /100 | #21 | Exceptional 49.2% |