Immigrants from Morocco vs Cheyenne Single Mother Households
COMPARE
Immigrants from Morocco
Cheyenne
Single Mother Households
Single Mother Households Comparison
Immigrants from Morocco
Cheyenne
6.3%
SINGLE MOTHER HOUSEHOLDS
50.0/ 100
METRIC RATING
174th/ 347
METRIC RANK
8.1%
SINGLE MOTHER HOUSEHOLDS
0.0/ 100
METRIC RATING
309th/ 347
METRIC RANK
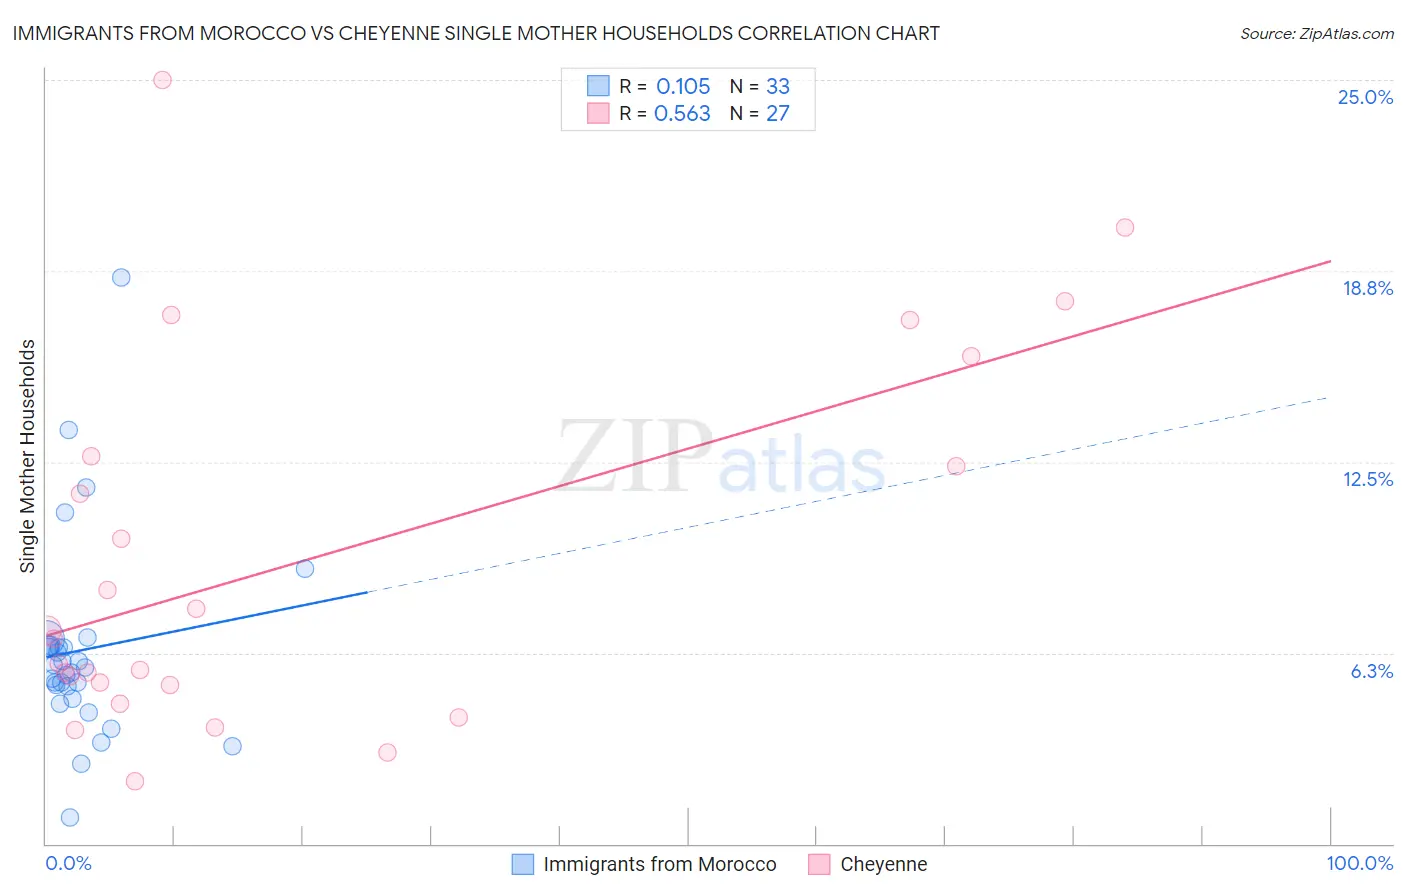
Immigrants from Morocco vs Cheyenne Single Mother Households Correlation Chart
The statistical analysis conducted on geographies consisting of 178,813,452 people shows a poor positive correlation between the proportion of Immigrants from Morocco and percentage of single mother households in the United States with a correlation coefficient (R) of 0.105 and weighted average of 6.3%. Similarly, the statistical analysis conducted on geographies consisting of 80,615,278 people shows a substantial positive correlation between the proportion of Cheyenne and percentage of single mother households in the United States with a correlation coefficient (R) of 0.563 and weighted average of 8.1%, a difference of 28.1%.
Single Mother Households Correlation Summary
| Measurement | Immigrants from Morocco | Cheyenne |
| Minimum | 0.87% | 2.1% |
| Maximum | 18.5% | 25.0% |
| Range | 17.7% | 22.9% |
| Mean | 6.3% | 9.2% |
| Median | 5.8% | 6.7% |
| Interquartile 25% (IQ1) | 5.0% | 5.2% |
| Interquartile 75% (IQ3) | 6.5% | 12.7% |
| Interquartile Range (IQR) | 1.5% | 7.5% |
| Standard Deviation (Sample) | 3.3% | 6.0% |
| Standard Deviation (Population) | 3.2% | 5.9% |
Similar Demographics by Single Mother Households
Demographics Similar to Immigrants from Morocco by Single Mother Households
In terms of single mother households, the demographic groups most similar to Immigrants from Morocco are Immigrants from Vietnam (6.3%, a difference of 0.17%), Immigrants from South Eastern Asia (6.3%, a difference of 0.24%), Afghan (6.3%, a difference of 0.28%), Marshallese (6.3%, a difference of 0.46%), and Immigrants from Oceania (6.3%, a difference of 0.50%).
| Demographics | Rating | Rank | Single Mother Households |
| Brazilians | 59.1 /100 | #167 | Average 6.2% |
| Immigrants | Chile | 58.3 /100 | #168 | Average 6.3% |
| Puget Sound Salish | 58.1 /100 | #169 | Average 6.3% |
| Immigrants | Oceania | 54.6 /100 | #170 | Average 6.3% |
| Afghans | 52.5 /100 | #171 | Average 6.3% |
| Immigrants | South Eastern Asia | 52.2 /100 | #172 | Average 6.3% |
| Immigrants | Vietnam | 51.5 /100 | #173 | Average 6.3% |
| Immigrants | Morocco | 50.0 /100 | #174 | Average 6.3% |
| Marshallese | 45.8 /100 | #175 | Average 6.3% |
| Immigrants | Bosnia and Herzegovina | 44.3 /100 | #176 | Average 6.3% |
| Osage | 43.0 /100 | #177 | Average 6.4% |
| Portuguese | 40.0 /100 | #178 | Fair 6.4% |
| Hmong | 39.8 /100 | #179 | Fair 6.4% |
| Immigrants | Nepal | 36.1 /100 | #180 | Fair 6.4% |
| Spanish | 33.4 /100 | #181 | Fair 6.4% |
Demographics Similar to Cheyenne by Single Mother Households
In terms of single mother households, the demographic groups most similar to Cheyenne are Honduran (8.1%, a difference of 0.050%), Immigrants from Congo (8.1%, a difference of 0.35%), Immigrants from Central America (8.1%, a difference of 0.44%), Immigrants from St. Vincent and the Grenadines (8.0%, a difference of 0.46%), and Bangladeshi (8.1%, a difference of 0.64%).
| Demographics | Rating | Rank | Single Mother Households |
| Immigrants | Ghana | 0.0 /100 | #302 | Tragic 8.0% |
| Immigrants | Bahamas | 0.0 /100 | #303 | Tragic 8.0% |
| Natives/Alaskans | 0.0 /100 | #304 | Tragic 8.0% |
| Colville | 0.0 /100 | #305 | Tragic 8.0% |
| Immigrants | Barbados | 0.0 /100 | #306 | Tragic 8.0% |
| Immigrants | St. Vincent and the Grenadines | 0.0 /100 | #307 | Tragic 8.0% |
| Immigrants | Central America | 0.0 /100 | #308 | Tragic 8.1% |
| Cheyenne | 0.0 /100 | #309 | Tragic 8.1% |
| Hondurans | 0.0 /100 | #310 | Tragic 8.1% |
| Immigrants | Congo | 0.0 /100 | #311 | Tragic 8.1% |
| Bangladeshis | 0.0 /100 | #312 | Tragic 8.1% |
| Immigrants | Grenada | 0.0 /100 | #313 | Tragic 8.2% |
| Immigrants | Mexico | 0.0 /100 | #314 | Tragic 8.2% |
| Immigrants | Western Africa | 0.0 /100 | #315 | Tragic 8.2% |
| Africans | 0.0 /100 | #316 | Tragic 8.2% |