Immigrants from Middle Africa vs Hawaiian Divorced or Separated
COMPARE
Immigrants from Middle Africa
Hawaiian
Divorced or Separated
Divorced or Separated Comparison
Immigrants from Middle Africa
Hawaiians
12.7%
DIVORCED OR SEPARATED
0.3/ 100
METRIC RATING
272nd/ 347
METRIC RANK
12.1%
DIVORCED OR SEPARATED
50.0/ 100
METRIC RATING
174th/ 347
METRIC RANK
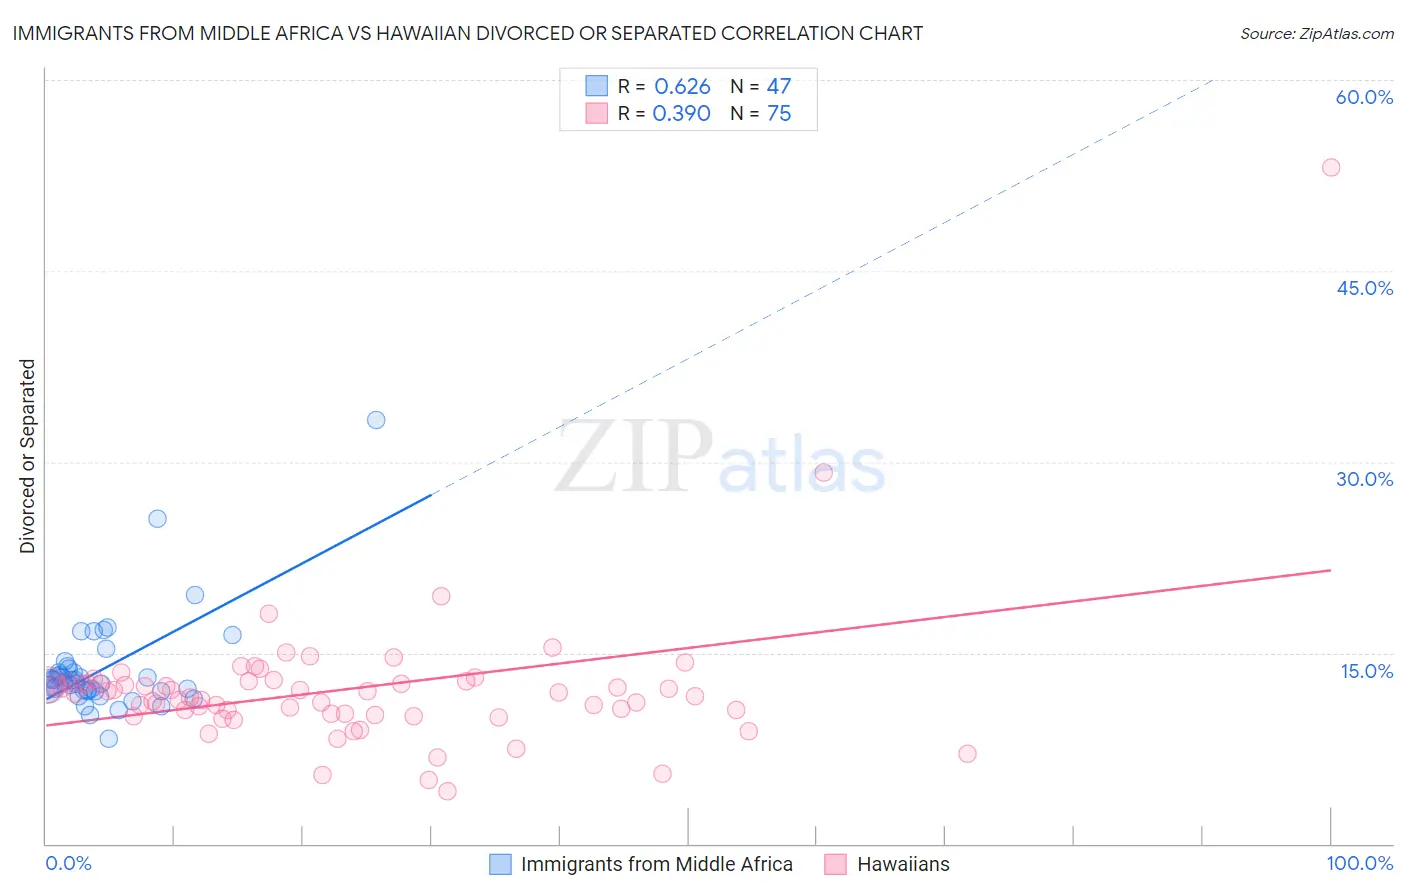
Immigrants from Middle Africa vs Hawaiian Divorced or Separated Correlation Chart
The statistical analysis conducted on geographies consisting of 202,678,495 people shows a significant positive correlation between the proportion of Immigrants from Middle Africa and percentage of population currently divorced or separated in the United States with a correlation coefficient (R) of 0.626 and weighted average of 12.7%. Similarly, the statistical analysis conducted on geographies consisting of 327,516,248 people shows a mild positive correlation between the proportion of Hawaiians and percentage of population currently divorced or separated in the United States with a correlation coefficient (R) of 0.390 and weighted average of 12.1%, a difference of 5.0%.
Divorced or Separated Correlation Summary
| Measurement | Immigrants from Middle Africa | Hawaiian |
| Minimum | 8.2% | 4.1% |
| Maximum | 33.3% | 53.1% |
| Range | 25.1% | 49.0% |
| Mean | 13.7% | 12.1% |
| Median | 12.8% | 11.8% |
| Interquartile 25% (IQ1) | 12.0% | 10.2% |
| Interquartile 75% (IQ3) | 13.7% | 12.7% |
| Interquartile Range (IQR) | 1.7% | 2.5% |
| Standard Deviation (Sample) | 4.0% | 5.8% |
| Standard Deviation (Population) | 3.9% | 5.8% |
Similar Demographics by Divorced or Separated
Demographics Similar to Immigrants from Middle Africa by Divorced or Separated
In terms of divorced or separated, the demographic groups most similar to Immigrants from Middle Africa are Panamanian (12.7%, a difference of 0.050%), Ute (12.6%, a difference of 0.11%), Immigrants from Micronesia (12.7%, a difference of 0.12%), Bermudan (12.7%, a difference of 0.13%), and Central American Indian (12.7%, a difference of 0.16%).
| Demographics | Rating | Rank | Divorced or Separated |
| Immigrants | Senegal | 0.5 /100 | #265 | Tragic 12.6% |
| Whites/Caucasians | 0.5 /100 | #266 | Tragic 12.6% |
| Scottish | 0.4 /100 | #267 | Tragic 12.6% |
| Fijians | 0.4 /100 | #268 | Tragic 12.6% |
| Immigrants | Liberia | 0.4 /100 | #269 | Tragic 12.6% |
| Ute | 0.4 /100 | #270 | Tragic 12.6% |
| Panamanians | 0.3 /100 | #271 | Tragic 12.7% |
| Immigrants | Middle Africa | 0.3 /100 | #272 | Tragic 12.7% |
| Immigrants | Micronesia | 0.3 /100 | #273 | Tragic 12.7% |
| Bermudans | 0.3 /100 | #274 | Tragic 12.7% |
| Central American Indians | 0.3 /100 | #275 | Tragic 12.7% |
| Spaniards | 0.2 /100 | #276 | Tragic 12.7% |
| Dominicans | 0.2 /100 | #277 | Tragic 12.7% |
| Lumbee | 0.2 /100 | #278 | Tragic 12.7% |
| Immigrants | Dominican Republic | 0.2 /100 | #279 | Tragic 12.7% |
Demographics Similar to Hawaiians by Divorced or Separated
In terms of divorced or separated, the demographic groups most similar to Hawaiians are Immigrants from Sierra Leone (12.1%, a difference of 0.0%), Immigrants from Moldova (12.1%, a difference of 0.020%), Pennsylvania German (12.1%, a difference of 0.040%), Brazilian (12.1%, a difference of 0.080%), and Immigrants from Mexico (12.0%, a difference of 0.11%).
| Demographics | Rating | Rank | Divorced or Separated |
| Ethiopians | 58.5 /100 | #167 | Average 12.0% |
| Serbians | 57.1 /100 | #168 | Average 12.0% |
| Immigrants | Peru | 57.0 /100 | #169 | Average 12.0% |
| Mexican American Indians | 55.8 /100 | #170 | Average 12.0% |
| Costa Ricans | 53.3 /100 | #171 | Average 12.0% |
| Immigrants | Mexico | 53.2 /100 | #172 | Average 12.0% |
| Immigrants | Moldova | 50.4 /100 | #173 | Average 12.1% |
| Hawaiians | 50.0 /100 | #174 | Average 12.1% |
| Immigrants | Sierra Leone | 50.0 /100 | #175 | Average 12.1% |
| Pennsylvania Germans | 48.9 /100 | #176 | Average 12.1% |
| Brazilians | 47.7 /100 | #177 | Average 12.1% |
| Ghanaians | 45.9 /100 | #178 | Average 12.1% |
| Immigrants | Western Europe | 45.6 /100 | #179 | Average 12.1% |
| Barbadians | 45.0 /100 | #180 | Average 12.1% |
| Immigrants | Canada | 44.0 /100 | #181 | Average 12.1% |