Immigrants from Micronesia vs Bermudan 5th Grade
COMPARE
Immigrants from Micronesia
Bermudan
5th Grade
5th Grade Comparison
Immigrants from Micronesia
Bermudans
97.3%
5TH GRADE
48.8/ 100
METRIC RATING
175th/ 347
METRIC RANK
97.4%
5TH GRADE
58.8/ 100
METRIC RATING
164th/ 347
METRIC RANK
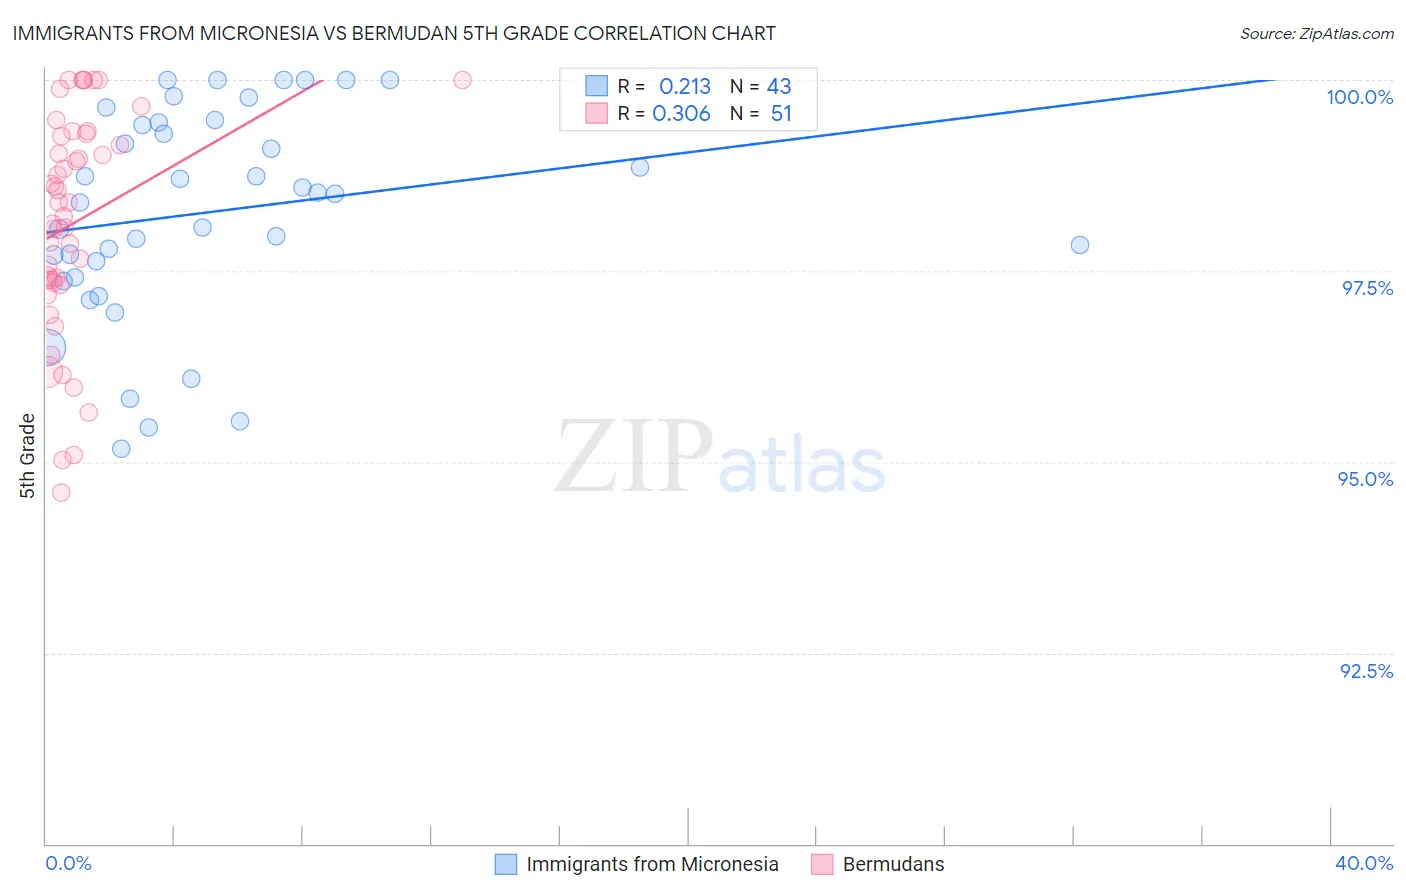
Immigrants from Micronesia vs Bermudan 5th Grade Correlation Chart
The statistical analysis conducted on geographies consisting of 61,604,657 people shows a weak positive correlation between the proportion of Immigrants from Micronesia and percentage of population with at least 5th grade education in the United States with a correlation coefficient (R) of 0.213 and weighted average of 97.3%. Similarly, the statistical analysis conducted on geographies consisting of 55,721,975 people shows a mild positive correlation between the proportion of Bermudans and percentage of population with at least 5th grade education in the United States with a correlation coefficient (R) of 0.306 and weighted average of 97.4%, a difference of 0.040%.
5th Grade Correlation Summary
| Measurement | Immigrants from Micronesia | Bermudan |
| Minimum | 95.2% | 94.6% |
| Maximum | 100.0% | 100.0% |
| Range | 4.8% | 5.4% |
| Mean | 98.3% | 98.1% |
| Median | 98.5% | 98.4% |
| Interquartile 25% (IQ1) | 97.4% | 97.3% |
| Interquartile 75% (IQ3) | 99.4% | 99.3% |
| Interquartile Range (IQR) | 2.0% | 2.0% |
| Standard Deviation (Sample) | 1.4% | 1.4% |
| Standard Deviation (Population) | 1.4% | 1.4% |
Demographics Similar to Immigrants from Micronesia and Bermudans by 5th Grade
In terms of 5th grade, the demographic groups most similar to Immigrants from Micronesia are Immigrants from Taiwan (97.3%, a difference of 0.0%), Egyptian (97.3%, a difference of 0.010%), Immigrants from Kazakhstan (97.3%, a difference of 0.010%), Immigrants from Spain (97.3%, a difference of 0.010%), and Immigrants from Belarus (97.3%, a difference of 0.020%). Similarly, the demographic groups most similar to Bermudans are Kenyan (97.4%, a difference of 0.0%), Immigrants from Iran (97.4%, a difference of 0.0%), Ugandan (97.4%, a difference of 0.0%), Immigrants from Poland (97.4%, a difference of 0.0%), and Marshallese (97.4%, a difference of 0.010%).
| Demographics | Rating | Rank | 5th Grade |
| Immigrants | Italy | 65.2 /100 | #159 | Good 97.4% |
| Marshallese | 61.2 /100 | #160 | Good 97.4% |
| Kenyans | 59.7 /100 | #161 | Average 97.4% |
| Immigrants | Iran | 59.5 /100 | #162 | Average 97.4% |
| Ugandans | 58.9 /100 | #163 | Average 97.4% |
| Bermudans | 58.8 /100 | #164 | Average 97.4% |
| Immigrants | Poland | 57.9 /100 | #165 | Average 97.4% |
| Apache | 57.2 /100 | #166 | Average 97.4% |
| Immigrants | Belarus | 54.6 /100 | #167 | Average 97.3% |
| Chileans | 54.5 /100 | #168 | Average 97.3% |
| Immigrants | Korea | 54.1 /100 | #169 | Average 97.3% |
| Venezuelans | 54.0 /100 | #170 | Average 97.3% |
| Immigrants | Sri Lanka | 53.8 /100 | #171 | Average 97.3% |
| Arabs | 53.4 /100 | #172 | Average 97.3% |
| Egyptians | 52.4 /100 | #173 | Average 97.3% |
| Immigrants | Kazakhstan | 50.0 /100 | #174 | Average 97.3% |
| Immigrants | Micronesia | 48.8 /100 | #175 | Average 97.3% |
| Immigrants | Taiwan | 48.4 /100 | #176 | Average 97.3% |
| Immigrants | Spain | 47.0 /100 | #177 | Average 97.3% |
| Comanche | 42.1 /100 | #178 | Average 97.3% |
| Immigrants | Kenya | 40.3 /100 | #179 | Average 97.3% |