Immigrants from Mexico vs Crow Family Households
COMPARE
Immigrants from Mexico
Crow
Family Households
Family Households Comparison
Immigrants from Mexico
Crow
69.1%
FAMILY HOUSEHOLDS
100.0/ 100
METRIC RATING
6th/ 347
METRIC RANK
65.3%
FAMILY HOUSEHOLDS
98.9/ 100
METRIC RATING
91st/ 347
METRIC RANK
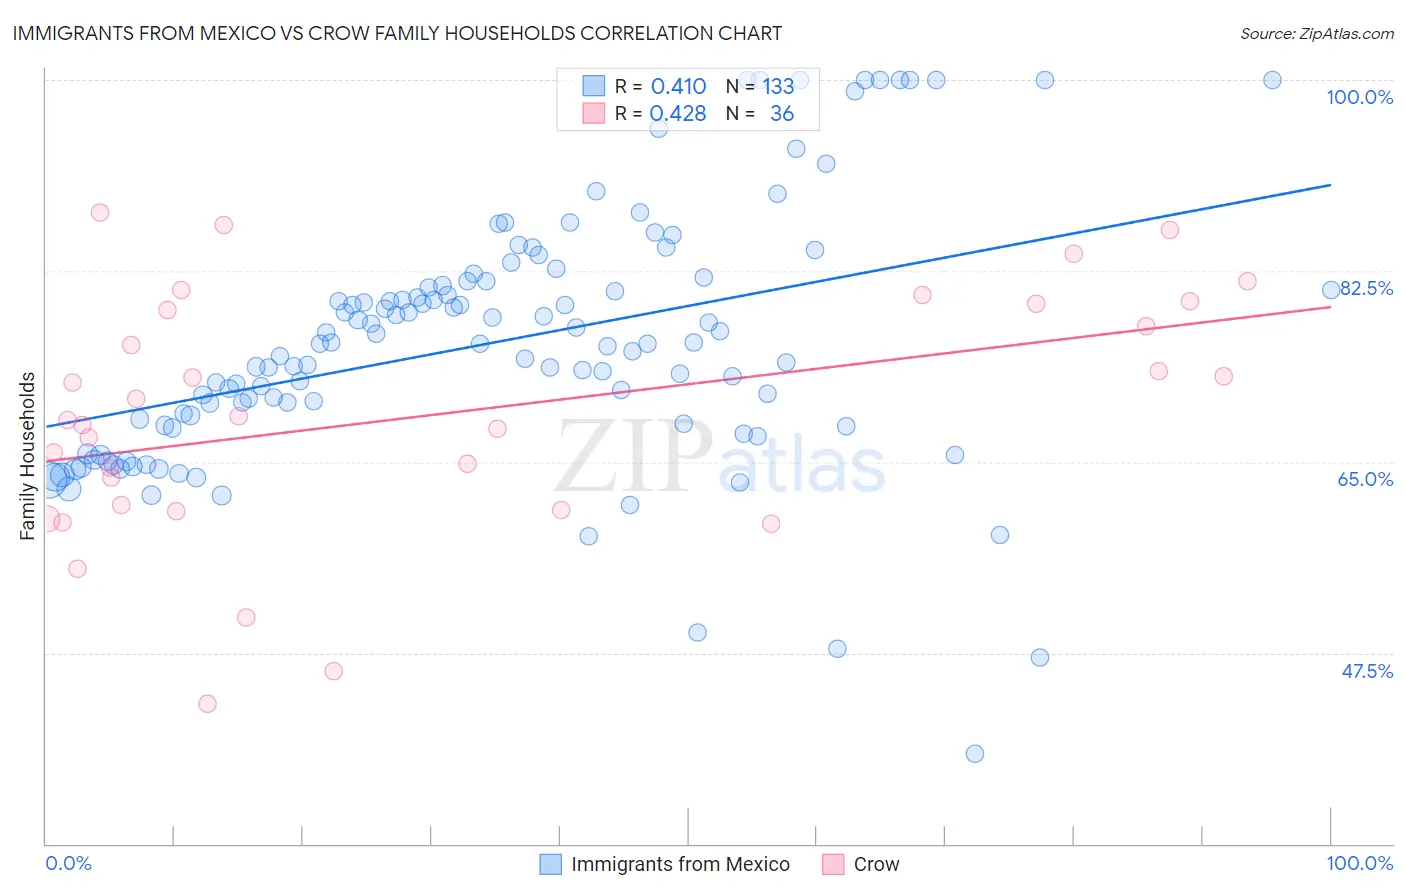
Immigrants from Mexico vs Crow Family Households Correlation Chart
The statistical analysis conducted on geographies consisting of 513,403,563 people shows a moderate positive correlation between the proportion of Immigrants from Mexico and percentage of family households in the United States with a correlation coefficient (R) of 0.410 and weighted average of 69.1%. Similarly, the statistical analysis conducted on geographies consisting of 59,202,817 people shows a moderate positive correlation between the proportion of Crow and percentage of family households in the United States with a correlation coefficient (R) of 0.428 and weighted average of 65.3%, a difference of 5.9%.
Family Households Correlation Summary
| Measurement | Immigrants from Mexico | Crow |
| Minimum | 38.2% | 42.9% |
| Maximum | 100.0% | 87.9% |
| Range | 61.8% | 45.0% |
| Mean | 75.8% | 69.3% |
| Median | 75.8% | 69.0% |
| Interquartile 25% (IQ1) | 68.3% | 60.8% |
| Interquartile 75% (IQ3) | 81.4% | 79.2% |
| Interquartile Range (IQR) | 13.1% | 18.4% |
| Standard Deviation (Sample) | 11.6% | 11.2% |
| Standard Deviation (Population) | 11.6% | 11.1% |
Similar Demographics by Family Households
Demographics Similar to Immigrants from Mexico by Family Households
In terms of family households, the demographic groups most similar to Immigrants from Mexico are Mexican (69.0%, a difference of 0.21%), Yuman (69.3%, a difference of 0.24%), Yakama (69.3%, a difference of 0.26%), Immigrants from Fiji (68.8%, a difference of 0.53%), and Tongan (69.6%, a difference of 0.71%).
| Demographics | Rating | Rank | Family Households |
| Yup'ik | 100 /100 | #1 | Exceptional 72.4% |
| Spanish American Indians | 100.0 /100 | #2 | Exceptional 71.2% |
| Tongans | 100.0 /100 | #3 | Exceptional 69.6% |
| Yakama | 100.0 /100 | #4 | Exceptional 69.3% |
| Yuman | 100.0 /100 | #5 | Exceptional 69.3% |
| Immigrants | Mexico | 100.0 /100 | #6 | Exceptional 69.1% |
| Mexicans | 100.0 /100 | #7 | Exceptional 69.0% |
| Immigrants | Fiji | 100.0 /100 | #8 | Exceptional 68.8% |
| Native Hawaiians | 100.0 /100 | #9 | Exceptional 68.4% |
| Immigrants | Philippines | 100.0 /100 | #10 | Exceptional 68.3% |
| Immigrants | Central America | 100.0 /100 | #11 | Exceptional 68.3% |
| Koreans | 100.0 /100 | #12 | Exceptional 68.3% |
| Pueblo | 100.0 /100 | #13 | Exceptional 68.2% |
| Immigrants | Cuba | 100.0 /100 | #14 | Exceptional 68.2% |
| Assyrians/Chaldeans/Syriacs | 100.0 /100 | #15 | Exceptional 68.2% |
Demographics Similar to Crow by Family Households
In terms of family households, the demographic groups most similar to Crow are Hopi (65.3%, a difference of 0.040%), Immigrants from Laos (65.3%, a difference of 0.050%), Guyanese (65.3%, a difference of 0.050%), Immigrants from Caribbean (65.3%, a difference of 0.060%), and Immigrants from Poland (65.2%, a difference of 0.060%).
| Demographics | Rating | Rank | Family Households |
| Americans | 99.6 /100 | #84 | Exceptional 65.5% |
| Immigrants | Cambodia | 99.5 /100 | #85 | Exceptional 65.4% |
| Egyptians | 99.4 /100 | #86 | Exceptional 65.4% |
| Immigrants | Egypt | 99.2 /100 | #87 | Exceptional 65.3% |
| Immigrants | Haiti | 99.1 /100 | #88 | Exceptional 65.3% |
| Immigrants | Caribbean | 99.1 /100 | #89 | Exceptional 65.3% |
| Immigrants | Laos | 99.1 /100 | #90 | Exceptional 65.3% |
| Crow | 98.9 /100 | #91 | Exceptional 65.3% |
| Hopi | 98.8 /100 | #92 | Exceptional 65.3% |
| Guyanese | 98.8 /100 | #93 | Exceptional 65.3% |
| Immigrants | Poland | 98.7 /100 | #94 | Exceptional 65.2% |
| Immigrants | Portugal | 98.6 /100 | #95 | Exceptional 65.2% |
| Swiss | 98.6 /100 | #96 | Exceptional 65.2% |
| Guatemalans | 98.6 /100 | #97 | Exceptional 65.2% |
| Immigrants | Syria | 98.4 /100 | #98 | Exceptional 65.2% |