Immigrants from Africa vs Crow Family Households
COMPARE
Immigrants from Africa
Crow
Family Households
Family Households Comparison
Immigrants from Africa
Crow
62.4%
FAMILY HOUSEHOLDS
0.0/ 100
METRIC RATING
300th/ 347
METRIC RANK
65.3%
FAMILY HOUSEHOLDS
98.9/ 100
METRIC RATING
91st/ 347
METRIC RANK
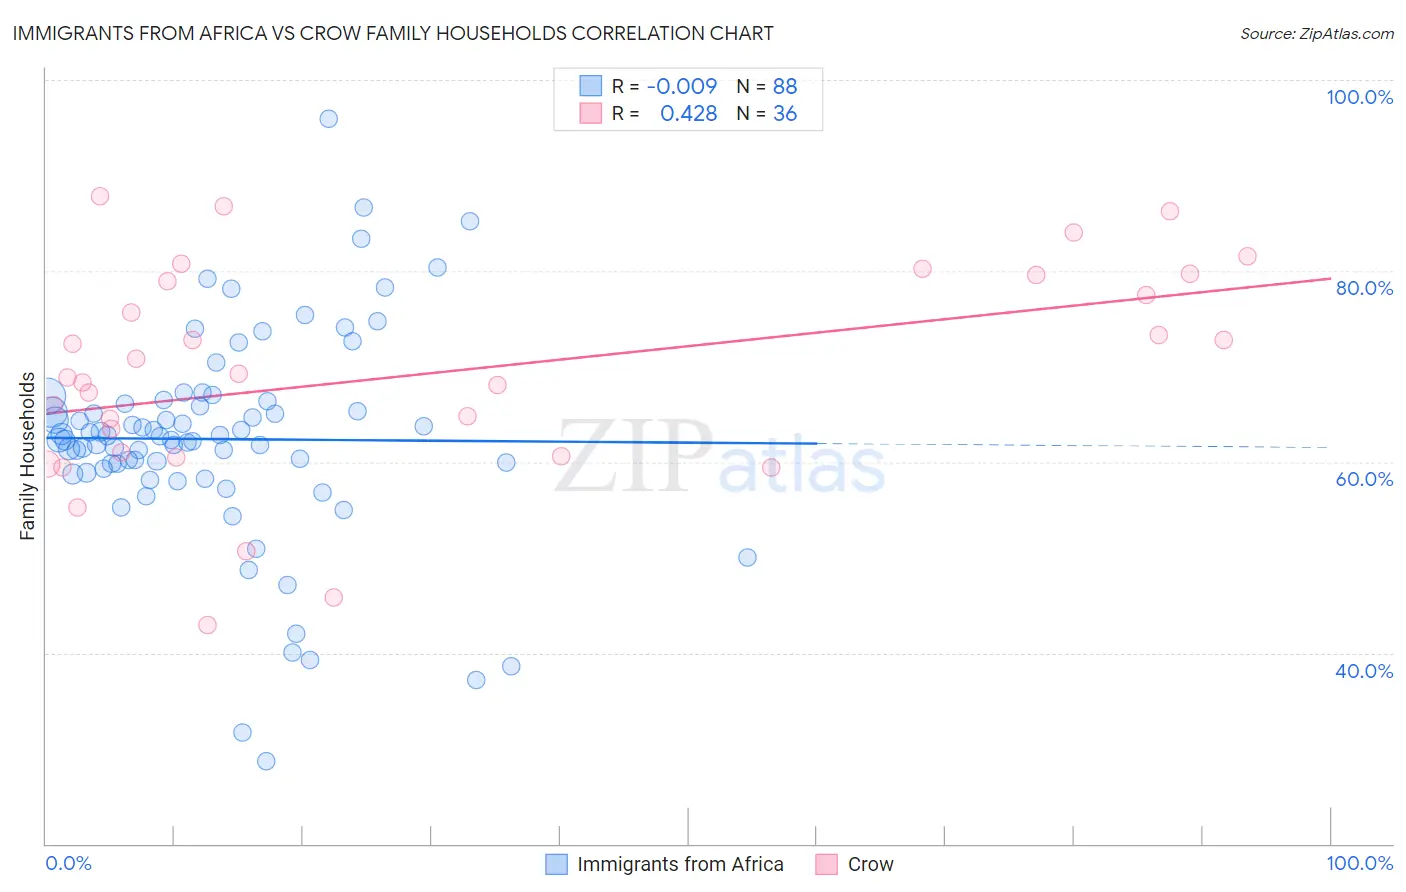
Immigrants from Africa vs Crow Family Households Correlation Chart
The statistical analysis conducted on geographies consisting of 468,955,500 people shows no correlation between the proportion of Immigrants from Africa and percentage of family households in the United States with a correlation coefficient (R) of -0.009 and weighted average of 62.4%. Similarly, the statistical analysis conducted on geographies consisting of 59,202,817 people shows a moderate positive correlation between the proportion of Crow and percentage of family households in the United States with a correlation coefficient (R) of 0.428 and weighted average of 65.3%, a difference of 4.6%.
Family Households Correlation Summary
| Measurement | Immigrants from Africa | Crow |
| Minimum | 28.7% | 42.9% |
| Maximum | 96.0% | 87.9% |
| Range | 67.3% | 45.0% |
| Mean | 62.4% | 69.3% |
| Median | 62.5% | 69.0% |
| Interquartile 25% (IQ1) | 59.1% | 60.8% |
| Interquartile 75% (IQ3) | 66.2% | 79.2% |
| Interquartile Range (IQR) | 7.2% | 18.4% |
| Standard Deviation (Sample) | 11.2% | 11.2% |
| Standard Deviation (Population) | 11.1% | 11.1% |
Similar Demographics by Family Households
Demographics Similar to Immigrants from Africa by Family Households
In terms of family households, the demographic groups most similar to Immigrants from Africa are Immigrants from Kuwait (62.4%, a difference of 0.0%), Immigrants from Albania (62.4%, a difference of 0.020%), Immigrants from Kenya (62.3%, a difference of 0.060%), Immigrants from Spain (62.4%, a difference of 0.070%), and French American Indian (62.4%, a difference of 0.090%).
| Demographics | Rating | Rank | Family Households |
| Immigrants | Sweden | 0.0 /100 | #293 | Tragic 62.5% |
| Barbadians | 0.0 /100 | #294 | Tragic 62.5% |
| Okinawans | 0.0 /100 | #295 | Tragic 62.5% |
| Slovenes | 0.0 /100 | #296 | Tragic 62.4% |
| French American Indians | 0.0 /100 | #297 | Tragic 62.4% |
| Immigrants | Spain | 0.0 /100 | #298 | Tragic 62.4% |
| Immigrants | Kuwait | 0.0 /100 | #299 | Tragic 62.4% |
| Immigrants | Africa | 0.0 /100 | #300 | Tragic 62.4% |
| Immigrants | Albania | 0.0 /100 | #301 | Tragic 62.4% |
| Immigrants | Kenya | 0.0 /100 | #302 | Tragic 62.3% |
| Cree | 0.0 /100 | #303 | Tragic 62.3% |
| Iroquois | 0.0 /100 | #304 | Tragic 62.2% |
| Bermudans | 0.0 /100 | #305 | Tragic 62.2% |
| Africans | 0.0 /100 | #306 | Tragic 62.1% |
| Immigrants | Norway | 0.0 /100 | #307 | Tragic 62.1% |
Demographics Similar to Crow by Family Households
In terms of family households, the demographic groups most similar to Crow are Hopi (65.3%, a difference of 0.040%), Immigrants from Laos (65.3%, a difference of 0.050%), Guyanese (65.3%, a difference of 0.050%), Immigrants from Caribbean (65.3%, a difference of 0.060%), and Immigrants from Poland (65.2%, a difference of 0.060%).
| Demographics | Rating | Rank | Family Households |
| Americans | 99.6 /100 | #84 | Exceptional 65.5% |
| Immigrants | Cambodia | 99.5 /100 | #85 | Exceptional 65.4% |
| Egyptians | 99.4 /100 | #86 | Exceptional 65.4% |
| Immigrants | Egypt | 99.2 /100 | #87 | Exceptional 65.3% |
| Immigrants | Haiti | 99.1 /100 | #88 | Exceptional 65.3% |
| Immigrants | Caribbean | 99.1 /100 | #89 | Exceptional 65.3% |
| Immigrants | Laos | 99.1 /100 | #90 | Exceptional 65.3% |
| Crow | 98.9 /100 | #91 | Exceptional 65.3% |
| Hopi | 98.8 /100 | #92 | Exceptional 65.3% |
| Guyanese | 98.8 /100 | #93 | Exceptional 65.3% |
| Immigrants | Poland | 98.7 /100 | #94 | Exceptional 65.2% |
| Immigrants | Portugal | 98.6 /100 | #95 | Exceptional 65.2% |
| Swiss | 98.6 /100 | #96 | Exceptional 65.2% |
| Guatemalans | 98.6 /100 | #97 | Exceptional 65.2% |
| Immigrants | Syria | 98.4 /100 | #98 | Exceptional 65.2% |