Immigrants from Lebanon vs Immigrants from Bosnia and Herzegovina Unemployment Among Ages 20 to 24 years
COMPARE
Immigrants from Lebanon
Immigrants from Bosnia and Herzegovina
Unemployment Among Ages 20 to 24 years
Unemployment Among Ages 20 to 24 years Comparison
Immigrants from Lebanon
Immigrants from Bosnia and Herzegovina
10.9%
UNEMPLOYMENT AMONG AGES 20 TO 24 YEARS
0.2/ 100
METRIC RATING
260th/ 347
METRIC RANK
9.4%
UNEMPLOYMENT AMONG AGES 20 TO 24 YEARS
100.0/ 100
METRIC RATING
21st/ 347
METRIC RANK
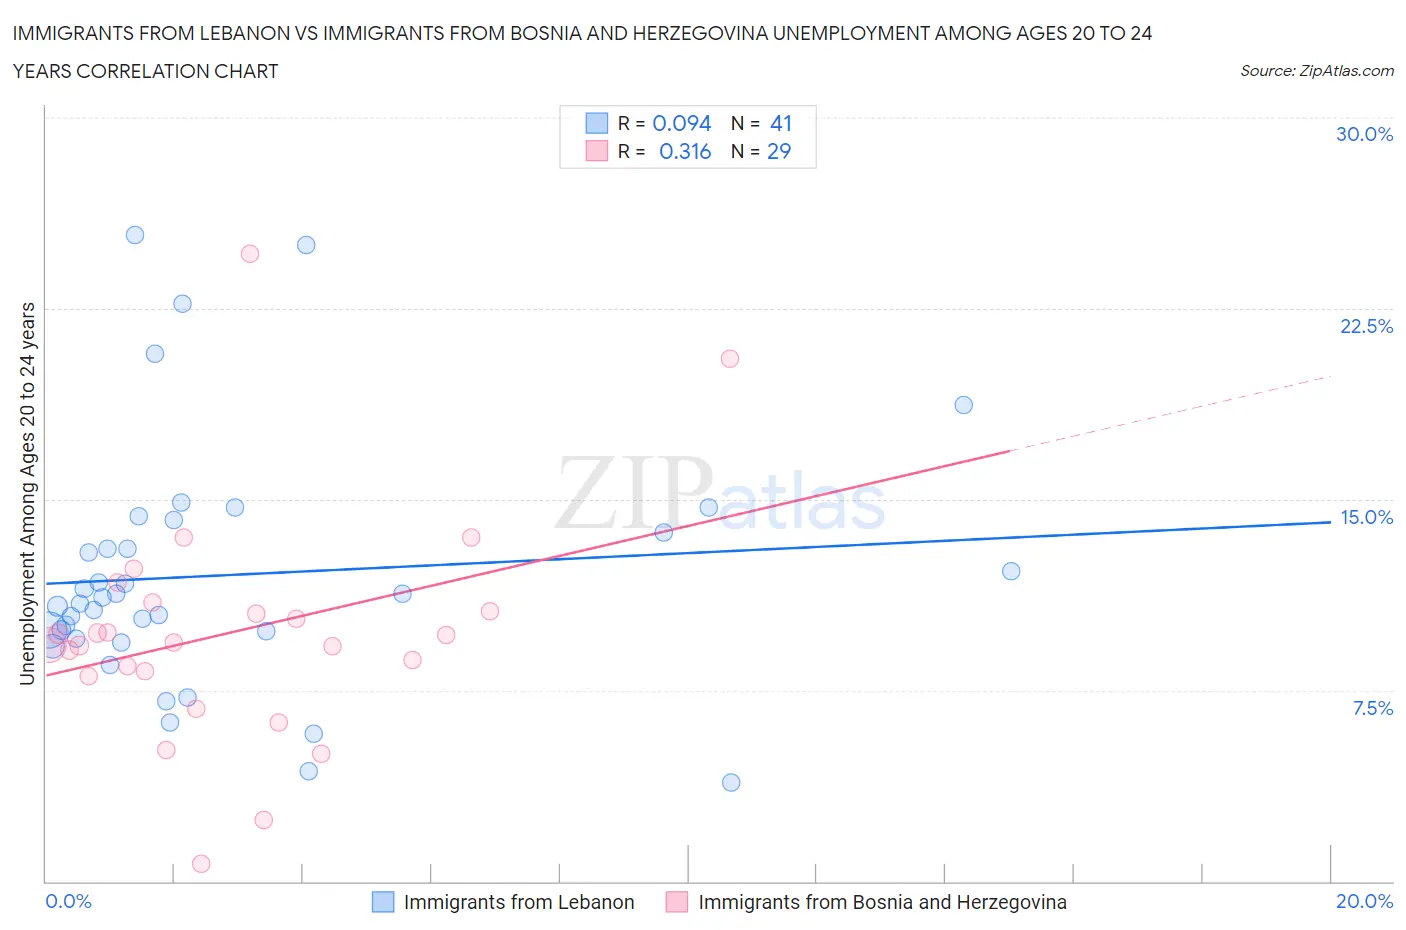
Immigrants from Lebanon vs Immigrants from Bosnia and Herzegovina Unemployment Among Ages 20 to 24 years Correlation Chart
The statistical analysis conducted on geographies consisting of 214,292,748 people shows a slight positive correlation between the proportion of Immigrants from Lebanon and unemployment rate among population between the ages 20 and 24 in the United States with a correlation coefficient (R) of 0.094 and weighted average of 10.9%. Similarly, the statistical analysis conducted on geographies consisting of 154,747,093 people shows a mild positive correlation between the proportion of Immigrants from Bosnia and Herzegovina and unemployment rate among population between the ages 20 and 24 in the United States with a correlation coefficient (R) of 0.316 and weighted average of 9.4%, a difference of 16.0%.
Unemployment Among Ages 20 to 24 years Correlation Summary
| Measurement | Immigrants from Lebanon | Immigrants from Bosnia and Herzegovina |
| Minimum | 3.9% | 0.70% |
| Maximum | 25.4% | 24.7% |
| Range | 21.5% | 24.0% |
| Mean | 12.0% | 9.8% |
| Median | 11.1% | 9.4% |
| Interquartile 25% (IQ1) | 9.7% | 8.1% |
| Interquartile 75% (IQ3) | 13.9% | 10.8% |
| Interquartile Range (IQR) | 4.3% | 2.6% |
| Standard Deviation (Sample) | 4.8% | 4.6% |
| Standard Deviation (Population) | 4.8% | 4.5% |
Similar Demographics by Unemployment Among Ages 20 to 24 years
Demographics Similar to Immigrants from Lebanon by Unemployment Among Ages 20 to 24 years
In terms of unemployment among ages 20 to 24 years, the demographic groups most similar to Immigrants from Lebanon are Panamanian (10.9%, a difference of 0.030%), Dutch West Indian (10.9%, a difference of 0.13%), Immigrants from Western Asia (10.9%, a difference of 0.20%), Puget Sound Salish (10.9%, a difference of 0.24%), and Immigrants from Bahamas (10.9%, a difference of 0.27%).
| Demographics | Rating | Rank | Unemployment Among Ages 20 to 24 years |
| Spanish Americans | 0.4 /100 | #253 | Tragic 10.8% |
| Liberians | 0.3 /100 | #254 | Tragic 10.8% |
| Immigrants | Israel | 0.3 /100 | #255 | Tragic 10.8% |
| Immigrants | Bahamas | 0.3 /100 | #256 | Tragic 10.9% |
| Immigrants | Western Asia | 0.3 /100 | #257 | Tragic 10.9% |
| Dutch West Indians | 0.3 /100 | #258 | Tragic 10.9% |
| Panamanians | 0.2 /100 | #259 | Tragic 10.9% |
| Immigrants | Lebanon | 0.2 /100 | #260 | Tragic 10.9% |
| Puget Sound Salish | 0.2 /100 | #261 | Tragic 10.9% |
| Immigrants | Latin America | 0.1 /100 | #262 | Tragic 11.0% |
| Marshallese | 0.1 /100 | #263 | Tragic 11.0% |
| Sub-Saharan Africans | 0.0 /100 | #264 | Tragic 11.1% |
| Immigrants | Ireland | 0.0 /100 | #265 | Tragic 11.1% |
| Immigrants | Liberia | 0.0 /100 | #266 | Tragic 11.1% |
| Immigrants | Greece | 0.0 /100 | #267 | Tragic 11.1% |
Demographics Similar to Immigrants from Bosnia and Herzegovina by Unemployment Among Ages 20 to 24 years
In terms of unemployment among ages 20 to 24 years, the demographic groups most similar to Immigrants from Bosnia and Herzegovina are Hmong (9.4%, a difference of 0.010%), Osage (9.4%, a difference of 0.010%), Chinese (9.4%, a difference of 0.13%), Tongan (9.4%, a difference of 0.27%), and Immigrants from Nepal (9.4%, a difference of 0.27%).
| Demographics | Rating | Rank | Unemployment Among Ages 20 to 24 years |
| Slovenes | 100.0 /100 | #14 | Exceptional 9.3% |
| Immigrants | Sudan | 100.0 /100 | #15 | Exceptional 9.3% |
| Danes | 100.0 /100 | #16 | Exceptional 9.3% |
| Czechs | 100.0 /100 | #17 | Exceptional 9.3% |
| Chinese | 100.0 /100 | #18 | Exceptional 9.4% |
| Hmong | 100.0 /100 | #19 | Exceptional 9.4% |
| Osage | 100.0 /100 | #20 | Exceptional 9.4% |
| Immigrants | Bosnia and Herzegovina | 100.0 /100 | #21 | Exceptional 9.4% |
| Tongans | 100.0 /100 | #22 | Exceptional 9.4% |
| Immigrants | Nepal | 100.0 /100 | #23 | Exceptional 9.4% |
| Taiwanese | 100.0 /100 | #24 | Exceptional 9.4% |
| Immigrants | Eritrea | 100.0 /100 | #25 | Exceptional 9.5% |
| Swedes | 100.0 /100 | #26 | Exceptional 9.5% |
| Immigrants | Zimbabwe | 100.0 /100 | #27 | Exceptional 9.5% |
| Immigrants | Afghanistan | 100.0 /100 | #28 | Exceptional 9.5% |