Immigrants from Latvia vs Immigrants from North America Single Father Households
COMPARE
Immigrants from Latvia
Immigrants from North America
Single Father Households
Single Father Households Comparison
Immigrants from Latvia
Immigrants from North America
1.9%
SINGLE FATHER HOUSEHOLDS
100.0/ 100
METRIC RATING
22nd/ 347
METRIC RANK
2.2%
SINGLE FATHER HOUSEHOLDS
98.2/ 100
METRIC RATING
114th/ 347
METRIC RANK
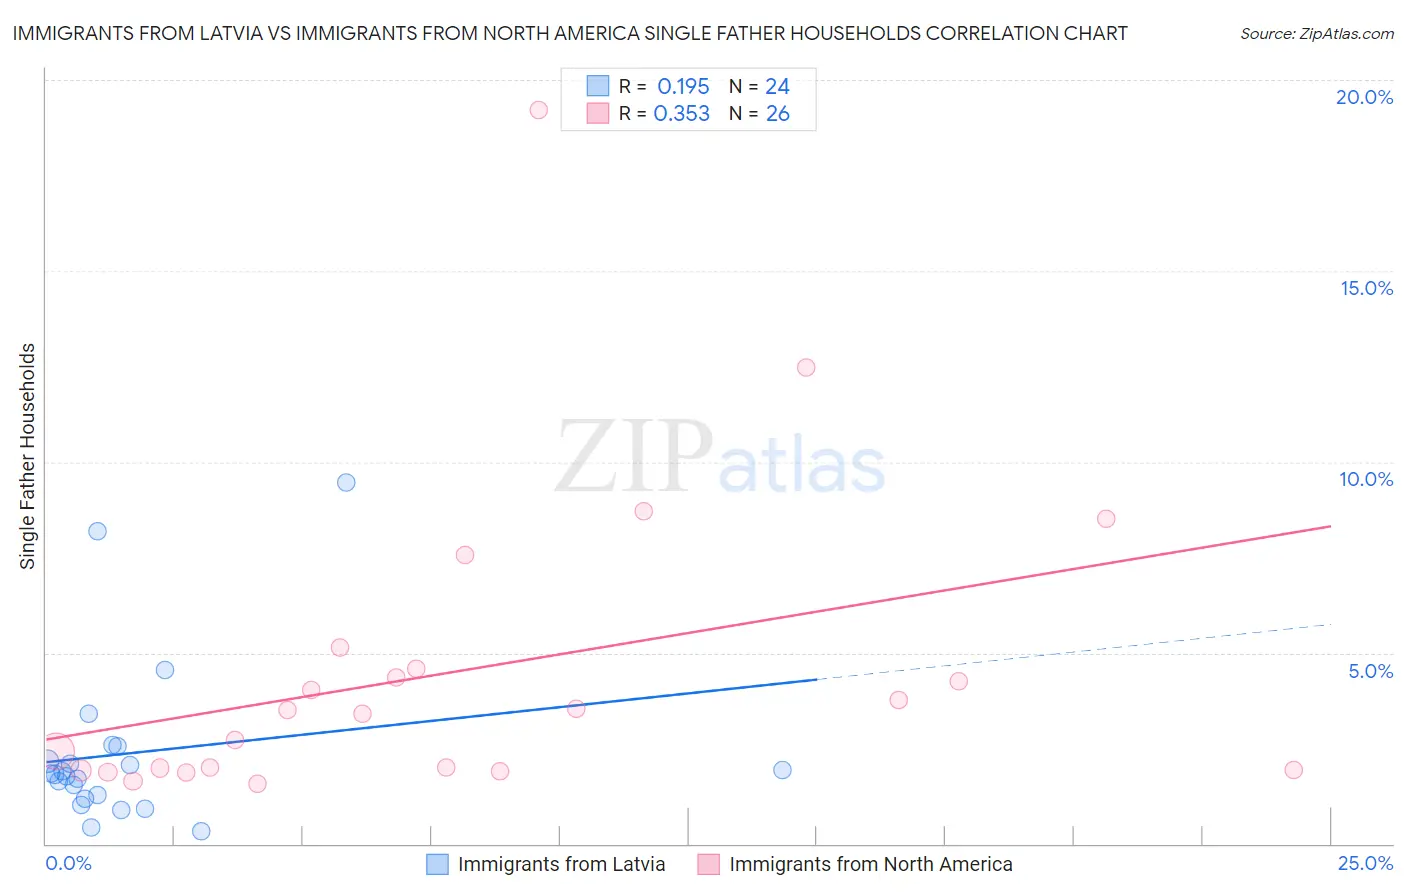
Immigrants from Latvia vs Immigrants from North America Single Father Households Correlation Chart
The statistical analysis conducted on geographies consisting of 113,497,933 people shows a poor positive correlation between the proportion of Immigrants from Latvia and percentage of single father households in the United States with a correlation coefficient (R) of 0.195 and weighted average of 1.9%. Similarly, the statistical analysis conducted on geographies consisting of 456,447,919 people shows a mild positive correlation between the proportion of Immigrants from North America and percentage of single father households in the United States with a correlation coefficient (R) of 0.353 and weighted average of 2.2%, a difference of 12.1%.
Single Father Households Correlation Summary
| Measurement | Immigrants from Latvia | Immigrants from North America |
| Minimum | 0.31% | 1.6% |
| Maximum | 9.5% | 19.2% |
| Range | 9.1% | 17.6% |
| Mean | 2.4% | 4.5% |
| Median | 1.8% | 3.4% |
| Interquartile 25% (IQ1) | 1.2% | 1.9% |
| Interquartile 75% (IQ3) | 2.3% | 4.6% |
| Interquartile Range (IQR) | 1.1% | 2.6% |
| Standard Deviation (Sample) | 2.2% | 4.0% |
| Standard Deviation (Population) | 2.1% | 3.9% |
Similar Demographics by Single Father Households
Demographics Similar to Immigrants from Latvia by Single Father Households
In terms of single father households, the demographic groups most similar to Immigrants from Latvia are Immigrants from Albania (1.9%, a difference of 0.19%), Thai (1.9%, a difference of 0.49%), Iranian (1.9%, a difference of 0.56%), Immigrants from Croatia (2.0%, a difference of 1.2%), and Immigrants from Russia (2.0%, a difference of 1.2%).
| Demographics | Rating | Rank | Single Father Households |
| Immigrants | Eastern Asia | 100.0 /100 | #15 | Exceptional 1.9% |
| Immigrants | Iran | 100.0 /100 | #16 | Exceptional 1.9% |
| Immigrants | India | 100.0 /100 | #17 | Exceptional 1.9% |
| Indians (Asian) | 100.0 /100 | #18 | Exceptional 1.9% |
| Iranians | 100.0 /100 | #19 | Exceptional 1.9% |
| Thais | 100.0 /100 | #20 | Exceptional 1.9% |
| Immigrants | Albania | 100.0 /100 | #21 | Exceptional 1.9% |
| Immigrants | Latvia | 100.0 /100 | #22 | Exceptional 1.9% |
| Immigrants | Croatia | 100.0 /100 | #23 | Exceptional 2.0% |
| Immigrants | Russia | 100.0 /100 | #24 | Exceptional 2.0% |
| Eastern Europeans | 100.0 /100 | #25 | Exceptional 2.0% |
| Assyrians/Chaldeans/Syriacs | 100.0 /100 | #26 | Exceptional 2.0% |
| Immigrants | South Central Asia | 100.0 /100 | #27 | Exceptional 2.0% |
| Immigrants | Japan | 100.0 /100 | #28 | Exceptional 2.0% |
| Bulgarians | 100.0 /100 | #29 | Exceptional 2.0% |
Demographics Similar to Immigrants from North America by Single Father Households
In terms of single father households, the demographic groups most similar to Immigrants from North America are Immigrants from Barbados (2.2%, a difference of 0.030%), Iraqi (2.2%, a difference of 0.040%), Immigrants from Trinidad and Tobago (2.2%, a difference of 0.060%), Immigrants from Argentina (2.2%, a difference of 0.060%), and Immigrants from Canada (2.2%, a difference of 0.090%).
| Demographics | Rating | Rank | Single Father Households |
| Slovenes | 98.5 /100 | #107 | Exceptional 2.2% |
| Immigrants | Netherlands | 98.5 /100 | #108 | Exceptional 2.2% |
| Barbadians | 98.4 /100 | #109 | Exceptional 2.2% |
| Italians | 98.3 /100 | #110 | Exceptional 2.2% |
| Immigrants | Canada | 98.3 /100 | #111 | Exceptional 2.2% |
| Immigrants | Trinidad and Tobago | 98.2 /100 | #112 | Exceptional 2.2% |
| Iraqis | 98.2 /100 | #113 | Exceptional 2.2% |
| Immigrants | North America | 98.2 /100 | #114 | Exceptional 2.2% |
| Immigrants | Barbados | 98.2 /100 | #115 | Exceptional 2.2% |
| Immigrants | Argentina | 98.1 /100 | #116 | Exceptional 2.2% |
| Hungarians | 97.9 /100 | #117 | Exceptional 2.2% |
| Immigrants | Morocco | 97.8 /100 | #118 | Exceptional 2.2% |
| Trinidadians and Tobagonians | 97.8 /100 | #119 | Exceptional 2.2% |
| Australians | 97.7 /100 | #120 | Exceptional 2.2% |
| Immigrants | Brazil | 97.7 /100 | #121 | Exceptional 2.2% |