Northern European vs Immigrants from North America Single Father Households
COMPARE
Northern European
Immigrants from North America
Single Father Households
Single Father Households Comparison
Northern Europeans
Immigrants from North America
2.2%
SINGLE FATHER HOUSEHOLDS
89.8/ 100
METRIC RATING
146th/ 347
METRIC RANK
2.2%
SINGLE FATHER HOUSEHOLDS
98.2/ 100
METRIC RATING
114th/ 347
METRIC RANK
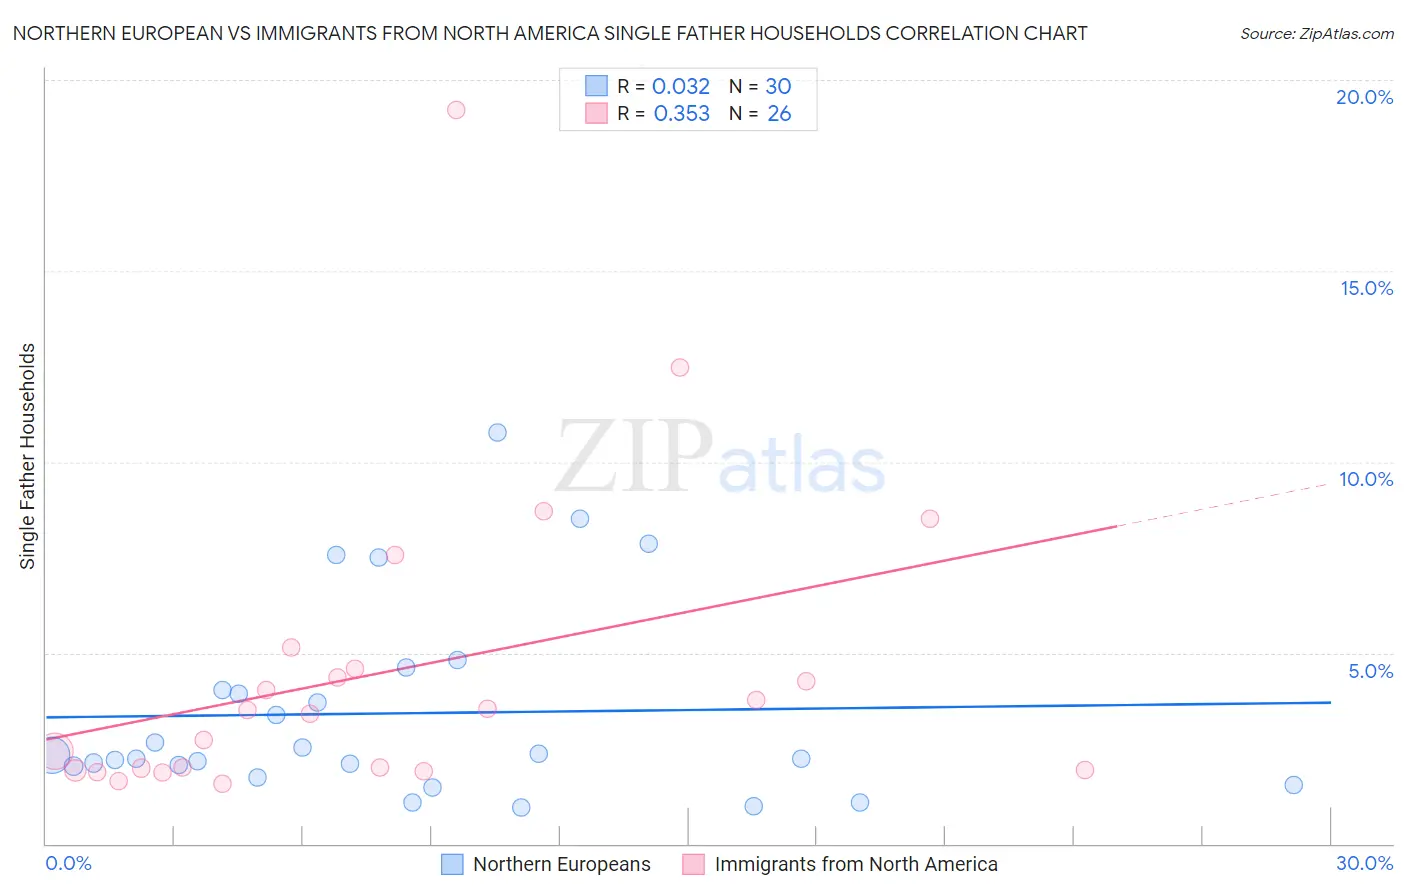
Northern European vs Immigrants from North America Single Father Households Correlation Chart
The statistical analysis conducted on geographies consisting of 401,873,140 people shows no correlation between the proportion of Northern Europeans and percentage of single father households in the United States with a correlation coefficient (R) of 0.032 and weighted average of 2.2%. Similarly, the statistical analysis conducted on geographies consisting of 456,447,919 people shows a mild positive correlation between the proportion of Immigrants from North America and percentage of single father households in the United States with a correlation coefficient (R) of 0.353 and weighted average of 2.2%, a difference of 3.6%.
Single Father Households Correlation Summary
| Measurement | Northern European | Immigrants from North America |
| Minimum | 0.95% | 1.6% |
| Maximum | 10.8% | 19.2% |
| Range | 9.8% | 17.6% |
| Mean | 3.4% | 4.5% |
| Median | 2.3% | 3.4% |
| Interquartile 25% (IQ1) | 2.0% | 1.9% |
| Interquartile 75% (IQ3) | 4.0% | 4.6% |
| Interquartile Range (IQR) | 2.0% | 2.6% |
| Standard Deviation (Sample) | 2.5% | 4.0% |
| Standard Deviation (Population) | 2.5% | 3.9% |
Similar Demographics by Single Father Households
Demographics Similar to Northern Europeans by Single Father Households
In terms of single father households, the demographic groups most similar to Northern Europeans are Immigrants from Zimbabwe (2.2%, a difference of 0.080%), Slavic (2.2%, a difference of 0.18%), Slovak (2.2%, a difference of 0.19%), South American Indian (2.3%, a difference of 0.27%), and Senegalese (2.3%, a difference of 0.28%).
| Demographics | Rating | Rank | Single Father Households |
| Brazilians | 92.8 /100 | #139 | Exceptional 2.2% |
| British | 92.8 /100 | #140 | Exceptional 2.2% |
| Laotians | 92.5 /100 | #141 | Exceptional 2.2% |
| Luxembourgers | 92.3 /100 | #142 | Exceptional 2.2% |
| Immigrants | Nepal | 92.1 /100 | #143 | Exceptional 2.2% |
| Slovaks | 90.7 /100 | #144 | Exceptional 2.2% |
| Immigrants | Zimbabwe | 90.2 /100 | #145 | Exceptional 2.2% |
| Northern Europeans | 89.8 /100 | #146 | Excellent 2.2% |
| Slavs | 88.9 /100 | #147 | Excellent 2.2% |
| South American Indians | 88.5 /100 | #148 | Excellent 2.3% |
| Senegalese | 88.4 /100 | #149 | Excellent 2.3% |
| Venezuelans | 86.2 /100 | #150 | Excellent 2.3% |
| Immigrants | Syria | 84.8 /100 | #151 | Excellent 2.3% |
| Immigrants | Venezuela | 83.2 /100 | #152 | Excellent 2.3% |
| Immigrants | Germany | 82.8 /100 | #153 | Excellent 2.3% |
Demographics Similar to Immigrants from North America by Single Father Households
In terms of single father households, the demographic groups most similar to Immigrants from North America are Immigrants from Barbados (2.2%, a difference of 0.030%), Iraqi (2.2%, a difference of 0.040%), Immigrants from Trinidad and Tobago (2.2%, a difference of 0.060%), Immigrants from Argentina (2.2%, a difference of 0.060%), and Immigrants from Canada (2.2%, a difference of 0.090%).
| Demographics | Rating | Rank | Single Father Households |
| Slovenes | 98.5 /100 | #107 | Exceptional 2.2% |
| Immigrants | Netherlands | 98.5 /100 | #108 | Exceptional 2.2% |
| Barbadians | 98.4 /100 | #109 | Exceptional 2.2% |
| Italians | 98.3 /100 | #110 | Exceptional 2.2% |
| Immigrants | Canada | 98.3 /100 | #111 | Exceptional 2.2% |
| Immigrants | Trinidad and Tobago | 98.2 /100 | #112 | Exceptional 2.2% |
| Iraqis | 98.2 /100 | #113 | Exceptional 2.2% |
| Immigrants | North America | 98.2 /100 | #114 | Exceptional 2.2% |
| Immigrants | Barbados | 98.2 /100 | #115 | Exceptional 2.2% |
| Immigrants | Argentina | 98.1 /100 | #116 | Exceptional 2.2% |
| Hungarians | 97.9 /100 | #117 | Exceptional 2.2% |
| Immigrants | Morocco | 97.8 /100 | #118 | Exceptional 2.2% |
| Trinidadians and Tobagonians | 97.8 /100 | #119 | Exceptional 2.2% |
| Australians | 97.7 /100 | #120 | Exceptional 2.2% |
| Immigrants | Brazil | 97.7 /100 | #121 | Exceptional 2.2% |