Immigrants from Eritrea vs Portuguese Single Father Households
COMPARE
Immigrants from Eritrea
Portuguese
Single Father Households
Single Father Households Comparison
Immigrants from Eritrea
Portuguese
2.5%
SINGLE FATHER HOUSEHOLDS
2.0/ 100
METRIC RATING
252nd/ 347
METRIC RANK
2.5%
SINGLE FATHER HOUSEHOLDS
4.1/ 100
METRIC RATING
241st/ 347
METRIC RANK
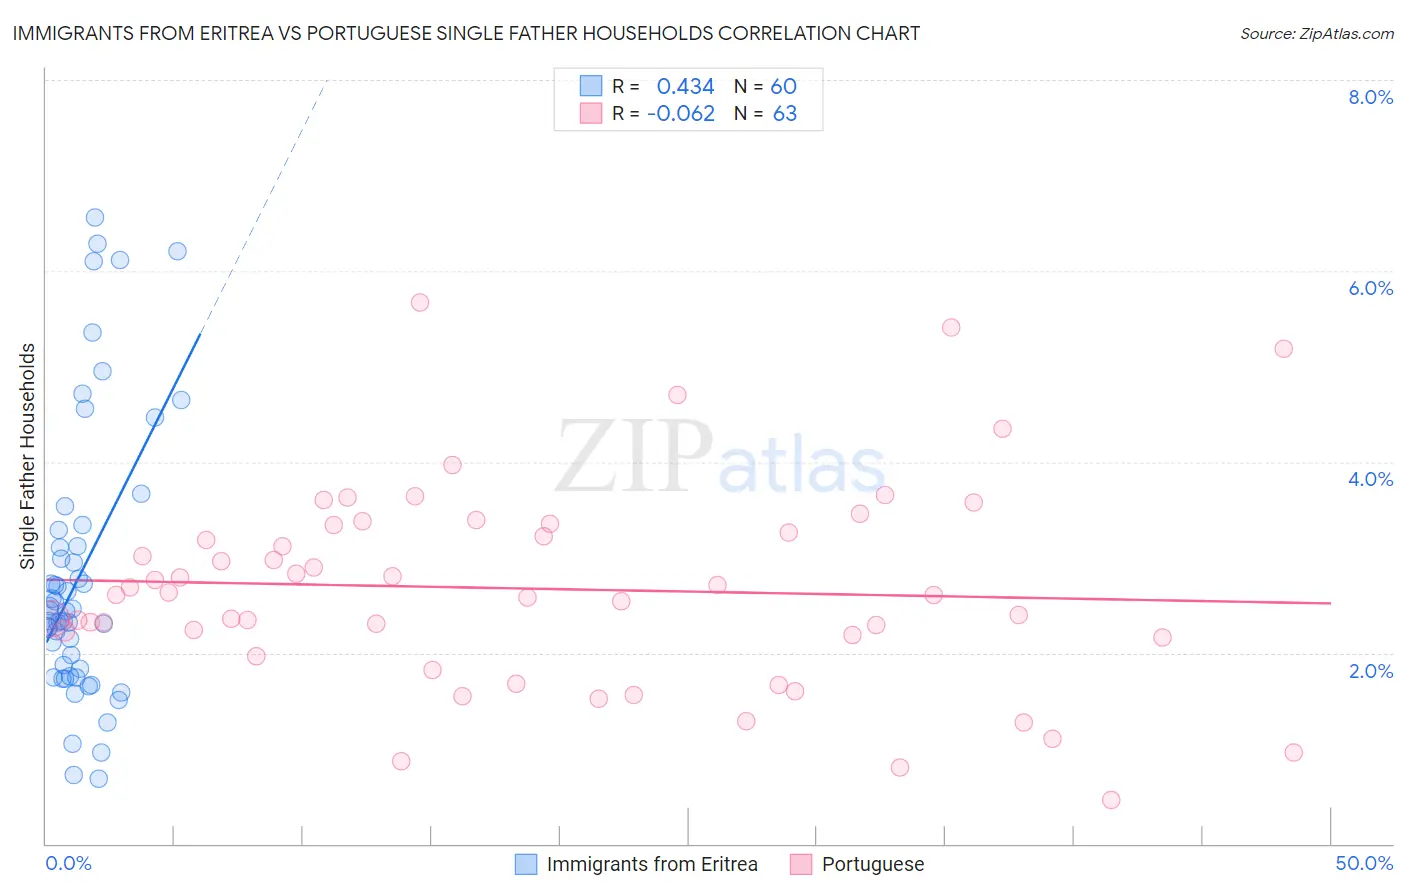
Immigrants from Eritrea vs Portuguese Single Father Households Correlation Chart
The statistical analysis conducted on geographies consisting of 104,791,168 people shows a moderate positive correlation between the proportion of Immigrants from Eritrea and percentage of single father households in the United States with a correlation coefficient (R) of 0.434 and weighted average of 2.5%. Similarly, the statistical analysis conducted on geographies consisting of 444,369,792 people shows a slight negative correlation between the proportion of Portuguese and percentage of single father households in the United States with a correlation coefficient (R) of -0.062 and weighted average of 2.5%, a difference of 1.3%.
Single Father Households Correlation Summary
| Measurement | Immigrants from Eritrea | Portuguese |
| Minimum | 0.67% | 0.46% |
| Maximum | 6.6% | 5.7% |
| Range | 5.9% | 5.2% |
| Mean | 2.8% | 2.7% |
| Median | 2.4% | 2.6% |
| Interquartile 25% (IQ1) | 1.8% | 2.2% |
| Interquartile 75% (IQ3) | 3.2% | 3.3% |
| Interquartile Range (IQR) | 1.4% | 1.2% |
| Standard Deviation (Sample) | 1.4% | 1.1% |
| Standard Deviation (Population) | 1.4% | 1.1% |
Demographics Similar to Immigrants from Eritrea and Portuguese by Single Father Households
In terms of single father households, the demographic groups most similar to Immigrants from Eritrea are Liberian (2.5%, a difference of 0.020%), Immigrants from Somalia (2.5%, a difference of 0.070%), Immigrants from Thailand (2.5%, a difference of 0.10%), Somali (2.5%, a difference of 0.11%), and Immigrants from Cameroon (2.5%, a difference of 0.28%). Similarly, the demographic groups most similar to Portuguese are Osage (2.5%, a difference of 0.030%), Immigrants from Dominica (2.5%, a difference of 0.26%), Spaniard (2.5%, a difference of 0.50%), Immigrants from Oceania (2.5%, a difference of 0.62%), and Immigrants from Sierra Leone (2.5%, a difference of 0.63%).
| Demographics | Rating | Rank | Single Father Households |
| Cajuns | 6.1 /100 | #236 | Tragic 2.5% |
| Sierra Leoneans | 5.9 /100 | #237 | Tragic 2.5% |
| Immigrants | Sierra Leone | 5.8 /100 | #238 | Tragic 2.5% |
| Immigrants | Oceania | 5.8 /100 | #239 | Tragic 2.5% |
| Immigrants | Dominica | 4.8 /100 | #240 | Tragic 2.5% |
| Portuguese | 4.1 /100 | #241 | Tragic 2.5% |
| Osage | 4.1 /100 | #242 | Tragic 2.5% |
| Spaniards | 3.1 /100 | #243 | Tragic 2.5% |
| Immigrants | Middle Africa | 2.8 /100 | #244 | Tragic 2.5% |
| Basques | 2.5 /100 | #245 | Tragic 2.5% |
| Native Hawaiians | 2.5 /100 | #246 | Tragic 2.5% |
| Delaware | 2.5 /100 | #247 | Tragic 2.5% |
| Bahamians | 2.4 /100 | #248 | Tragic 2.5% |
| Immigrants | Cameroon | 2.3 /100 | #249 | Tragic 2.5% |
| Somalis | 2.1 /100 | #250 | Tragic 2.5% |
| Liberians | 2.0 /100 | #251 | Tragic 2.5% |
| Immigrants | Eritrea | 2.0 /100 | #252 | Tragic 2.5% |
| Immigrants | Somalia | 1.9 /100 | #253 | Tragic 2.5% |
| Immigrants | Thailand | 1.8 /100 | #254 | Tragic 2.5% |
| Tongans | 1.5 /100 | #255 | Tragic 2.5% |
| Potawatomi | 1.4 /100 | #256 | Tragic 2.5% |