Immigrants from Laos vs Belizean Currently Married
COMPARE
Immigrants from Laos
Belizean
Currently Married
Currently Married Comparison
Immigrants from Laos
Belizeans
45.0%
CURRENTLY MARRIED
2.3/ 100
METRIC RATING
223rd/ 347
METRIC RANK
42.2%
CURRENTLY MARRIED
0.0/ 100
METRIC RATING
300th/ 347
METRIC RANK
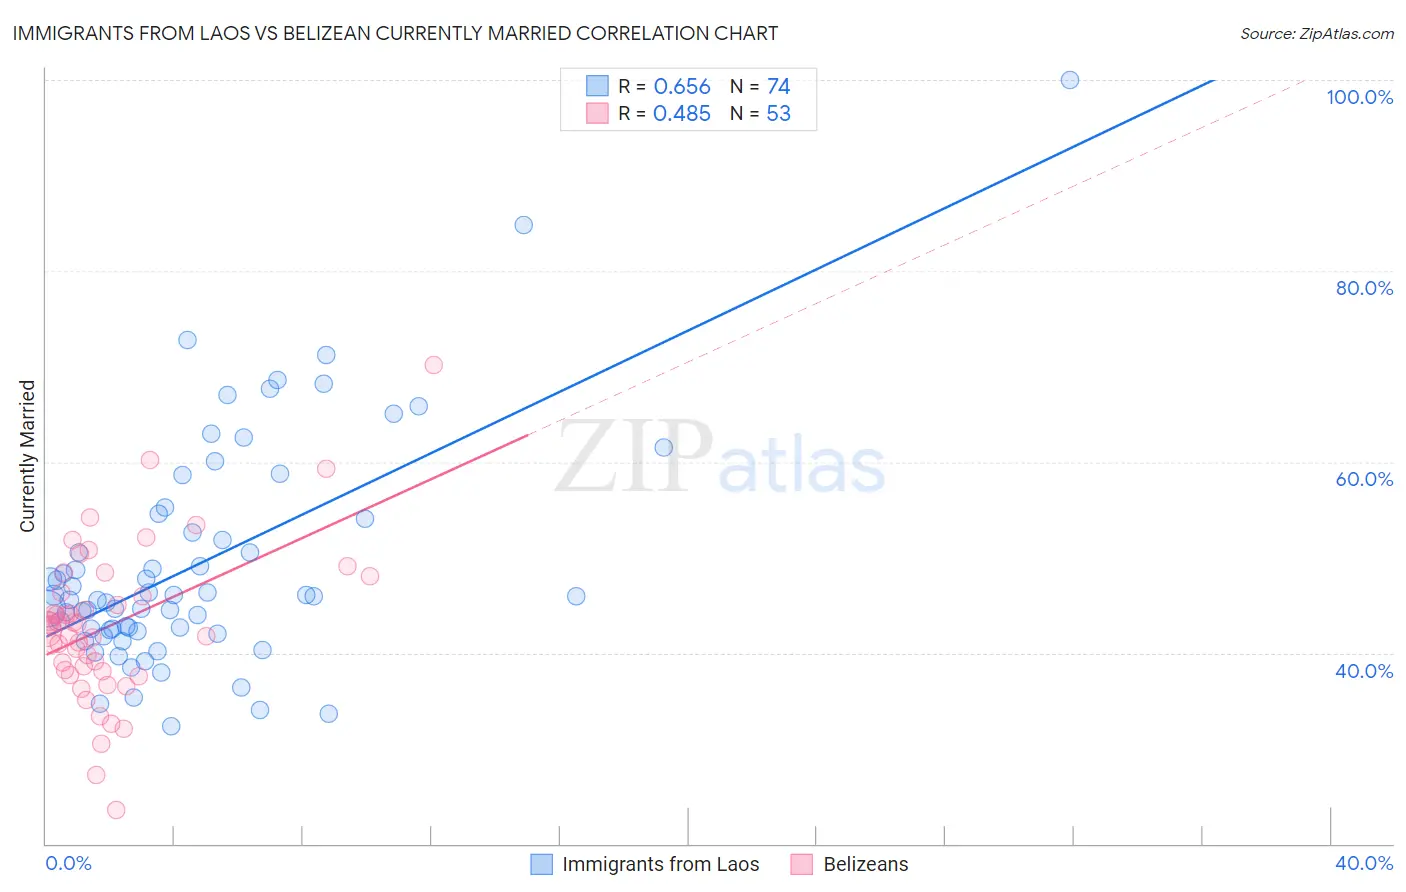
Immigrants from Laos vs Belizean Currently Married Correlation Chart
The statistical analysis conducted on geographies consisting of 201,475,641 people shows a significant positive correlation between the proportion of Immigrants from Laos and percentage of population currently married in the United States with a correlation coefficient (R) of 0.656 and weighted average of 45.0%. Similarly, the statistical analysis conducted on geographies consisting of 144,212,972 people shows a moderate positive correlation between the proportion of Belizeans and percentage of population currently married in the United States with a correlation coefficient (R) of 0.485 and weighted average of 42.2%, a difference of 6.8%.
Currently Married Correlation Summary
| Measurement | Immigrants from Laos | Belizean |
| Minimum | 32.3% | 23.5% |
| Maximum | 100.0% | 70.1% |
| Range | 67.7% | 46.6% |
| Mean | 49.4% | 42.9% |
| Median | 45.9% | 42.8% |
| Interquartile 25% (IQ1) | 42.3% | 38.2% |
| Interquartile 75% (IQ3) | 54.1% | 47.1% |
| Interquartile Range (IQR) | 11.8% | 9.0% |
| Standard Deviation (Sample) | 12.1% | 8.1% |
| Standard Deviation (Population) | 12.0% | 8.1% |
Similar Demographics by Currently Married
Demographics Similar to Immigrants from Laos by Currently Married
In terms of currently married, the demographic groups most similar to Immigrants from Laos are Immigrants from Uganda (45.0%, a difference of 0.050%), French American Indian (45.0%, a difference of 0.050%), Immigrants from the Azores (45.1%, a difference of 0.080%), Comanche (45.0%, a difference of 0.10%), and Spanish American (45.0%, a difference of 0.10%).
| Demographics | Rating | Rank | Currently Married |
| Immigrants | Morocco | 5.5 /100 | #216 | Tragic 45.4% |
| Immigrants | Thailand | 5.1 /100 | #217 | Tragic 45.4% |
| Panamanians | 4.0 /100 | #218 | Tragic 45.3% |
| Immigrants | Portugal | 3.5 /100 | #219 | Tragic 45.2% |
| Kenyans | 3.1 /100 | #220 | Tragic 45.2% |
| Mexicans | 3.0 /100 | #221 | Tragic 45.2% |
| Immigrants | Azores | 2.5 /100 | #222 | Tragic 45.1% |
| Immigrants | Laos | 2.3 /100 | #223 | Tragic 45.0% |
| Immigrants | Uganda | 2.2 /100 | #224 | Tragic 45.0% |
| French American Indians | 2.2 /100 | #225 | Tragic 45.0% |
| Comanche | 2.1 /100 | #226 | Tragic 45.0% |
| Spanish Americans | 2.1 /100 | #227 | Tragic 45.0% |
| Immigrants | Uruguay | 2.0 /100 | #228 | Tragic 45.0% |
| Cree | 1.7 /100 | #229 | Tragic 44.9% |
| Immigrants | Kenya | 1.6 /100 | #230 | Tragic 44.9% |
Demographics Similar to Belizeans by Currently Married
In terms of currently married, the demographic groups most similar to Belizeans are Liberian (42.2%, a difference of 0.10%), Immigrants from Honduras (42.2%, a difference of 0.13%), Cheyenne (42.2%, a difference of 0.22%), Immigrants from Yemen (42.1%, a difference of 0.24%), and Menominee (42.3%, a difference of 0.33%).
| Demographics | Rating | Rank | Currently Married |
| Yuman | 0.0 /100 | #293 | Tragic 42.6% |
| Hondurans | 0.0 /100 | #294 | Tragic 42.5% |
| Immigrants | Western Africa | 0.0 /100 | #295 | Tragic 42.4% |
| Menominee | 0.0 /100 | #296 | Tragic 42.3% |
| Cheyenne | 0.0 /100 | #297 | Tragic 42.2% |
| Immigrants | Honduras | 0.0 /100 | #298 | Tragic 42.2% |
| Liberians | 0.0 /100 | #299 | Tragic 42.2% |
| Belizeans | 0.0 /100 | #300 | Tragic 42.2% |
| Immigrants | Yemen | 0.0 /100 | #301 | Tragic 42.1% |
| Immigrants | Zaire | 0.0 /100 | #302 | Tragic 42.0% |
| Sioux | 0.0 /100 | #303 | Tragic 41.9% |
| Immigrants | Bahamas | 0.0 /100 | #304 | Tragic 41.9% |
| Immigrants | Trinidad and Tobago | 0.0 /100 | #305 | Tragic 41.9% |
| Immigrants | Guyana | 0.0 /100 | #306 | Tragic 41.9% |
| Africans | 0.0 /100 | #307 | Tragic 41.8% |