Immigrants from Egypt vs Austrian Currently Married
COMPARE
Immigrants from Egypt
Austrian
Currently Married
Currently Married Comparison
Immigrants from Egypt
Austrians
47.7%
CURRENTLY MARRIED
92.3/ 100
METRIC RATING
109th/ 347
METRIC RANK
48.7%
CURRENTLY MARRIED
99.2/ 100
METRIC RATING
48th/ 347
METRIC RANK
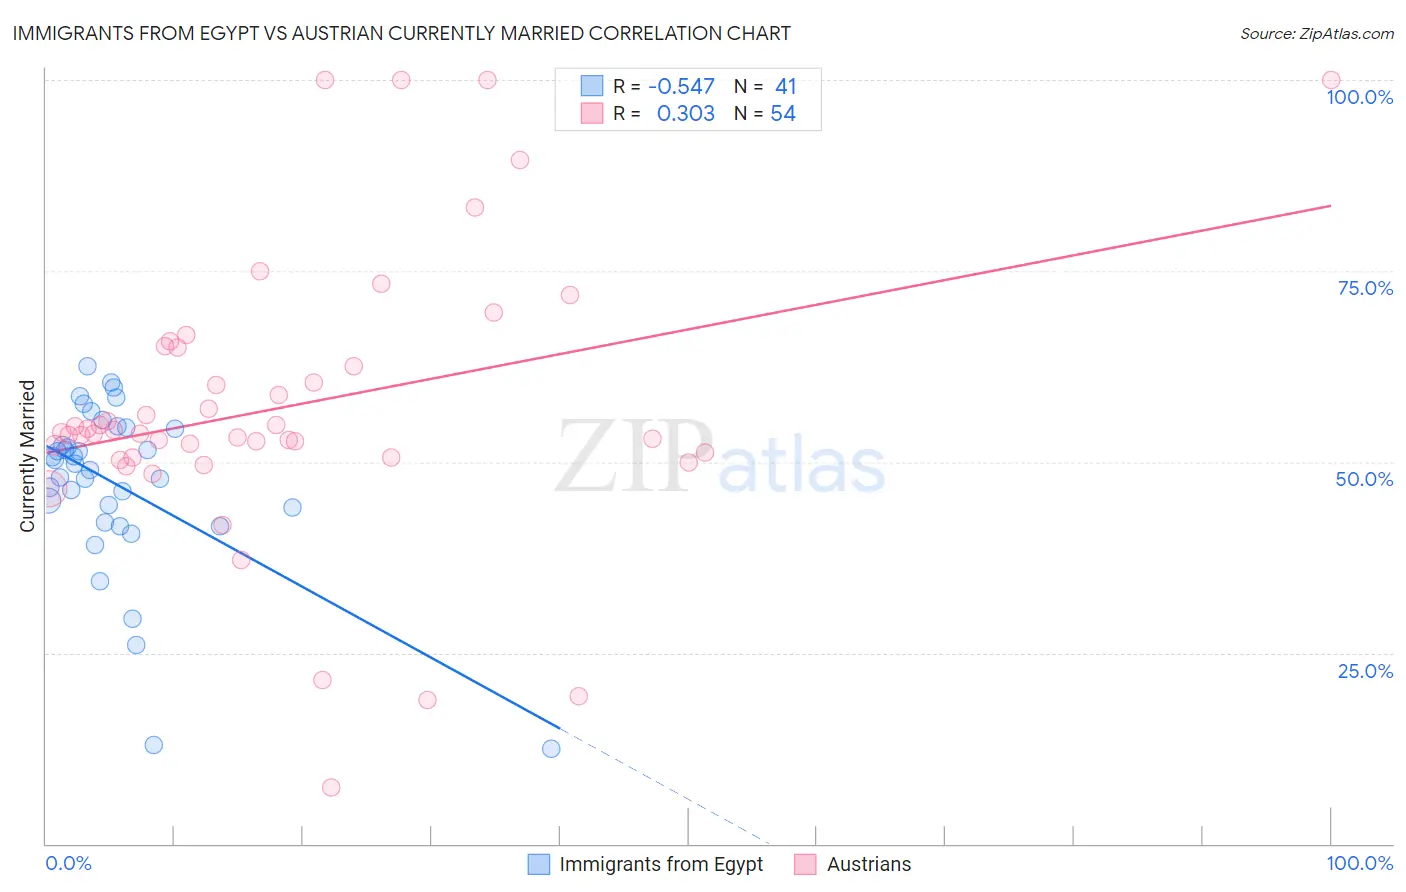
Immigrants from Egypt vs Austrian Currently Married Correlation Chart
The statistical analysis conducted on geographies consisting of 245,480,617 people shows a substantial negative correlation between the proportion of Immigrants from Egypt and percentage of population currently married in the United States with a correlation coefficient (R) of -0.547 and weighted average of 47.7%. Similarly, the statistical analysis conducted on geographies consisting of 452,025,690 people shows a mild positive correlation between the proportion of Austrians and percentage of population currently married in the United States with a correlation coefficient (R) of 0.303 and weighted average of 48.7%, a difference of 2.1%.
Currently Married Correlation Summary
| Measurement | Immigrants from Egypt | Austrian |
| Minimum | 12.5% | 7.4% |
| Maximum | 62.5% | 100.0% |
| Range | 50.0% | 92.6% |
| Mean | 47.1% | 57.2% |
| Median | 49.7% | 53.8% |
| Interquartile 25% (IQ1) | 43.1% | 50.6% |
| Interquartile 75% (IQ3) | 54.5% | 64.9% |
| Interquartile Range (IQR) | 11.4% | 14.3% |
| Standard Deviation (Sample) | 11.1% | 18.6% |
| Standard Deviation (Population) | 11.0% | 18.5% |
Similar Demographics by Currently Married
Demographics Similar to Immigrants from Egypt by Currently Married
In terms of currently married, the demographic groups most similar to Immigrants from Egypt are Tsimshian (47.7%, a difference of 0.010%), Immigrants from Russia (47.7%, a difference of 0.040%), Immigrants from Italy (47.7%, a difference of 0.080%), Immigrants from Greece (47.7%, a difference of 0.11%), and Immigrants from Hungary (47.6%, a difference of 0.13%).
| Demographics | Rating | Rank | Currently Married |
| Turks | 93.9 /100 | #102 | Exceptional 47.8% |
| Cypriots | 93.7 /100 | #103 | Exceptional 47.8% |
| Serbians | 93.6 /100 | #104 | Exceptional 47.8% |
| Immigrants | Singapore | 93.3 /100 | #105 | Exceptional 47.8% |
| Immigrants | Greece | 93.1 /100 | #106 | Exceptional 47.7% |
| Immigrants | Italy | 92.9 /100 | #107 | Exceptional 47.7% |
| Tsimshian | 92.4 /100 | #108 | Exceptional 47.7% |
| Immigrants | Egypt | 92.3 /100 | #109 | Exceptional 47.7% |
| Immigrants | Russia | 92.0 /100 | #110 | Exceptional 47.7% |
| Immigrants | Hungary | 91.2 /100 | #111 | Exceptional 47.6% |
| Immigrants | Western Europe | 91.1 /100 | #112 | Exceptional 47.6% |
| Immigrants | Denmark | 90.9 /100 | #113 | Exceptional 47.6% |
| South Africans | 90.5 /100 | #114 | Exceptional 47.6% |
| Immigrants | Indonesia | 90.5 /100 | #115 | Exceptional 47.6% |
| Palestinians | 90.4 /100 | #116 | Exceptional 47.6% |
Demographics Similar to Austrians by Currently Married
In terms of currently married, the demographic groups most similar to Austrians are Northern European (48.7%, a difference of 0.010%), Immigrants from Iran (48.7%, a difference of 0.020%), Belgian (48.7%, a difference of 0.050%), Immigrants from North America (48.7%, a difference of 0.080%), and Finnish (48.8%, a difference of 0.11%).
| Demographics | Rating | Rank | Currently Married |
| Greeks | 99.3 /100 | #41 | Exceptional 48.8% |
| Finns | 99.3 /100 | #42 | Exceptional 48.8% |
| Scotch-Irish | 99.3 /100 | #43 | Exceptional 48.7% |
| Immigrants | North America | 99.3 /100 | #44 | Exceptional 48.7% |
| Belgians | 99.3 /100 | #45 | Exceptional 48.7% |
| Immigrants | Iran | 99.2 /100 | #46 | Exceptional 48.7% |
| Northern Europeans | 99.2 /100 | #47 | Exceptional 48.7% |
| Austrians | 99.2 /100 | #48 | Exceptional 48.7% |
| Bhutanese | 99.1 /100 | #49 | Exceptional 48.6% |
| Iranians | 99.0 /100 | #50 | Exceptional 48.6% |
| Whites/Caucasians | 99.0 /100 | #51 | Exceptional 48.6% |
| Russians | 98.9 /100 | #52 | Exceptional 48.6% |
| Immigrants | Austria | 98.8 /100 | #53 | Exceptional 48.5% |
| Immigrants | Moldova | 98.7 /100 | #54 | Exceptional 48.5% |
| Immigrants | North Macedonia | 98.7 /100 | #55 | Exceptional 48.5% |