Immigrants from Korea vs Ghanaian Family Households
COMPARE
Immigrants from Korea
Ghanaian
Family Households
Family Households Comparison
Immigrants from Korea
Ghanaians
66.0%
FAMILY HOUSEHOLDS
100.0/ 100
METRIC RATING
59th/ 347
METRIC RANK
63.5%
FAMILY HOUSEHOLDS
2.1/ 100
METRIC RATING
236th/ 347
METRIC RANK
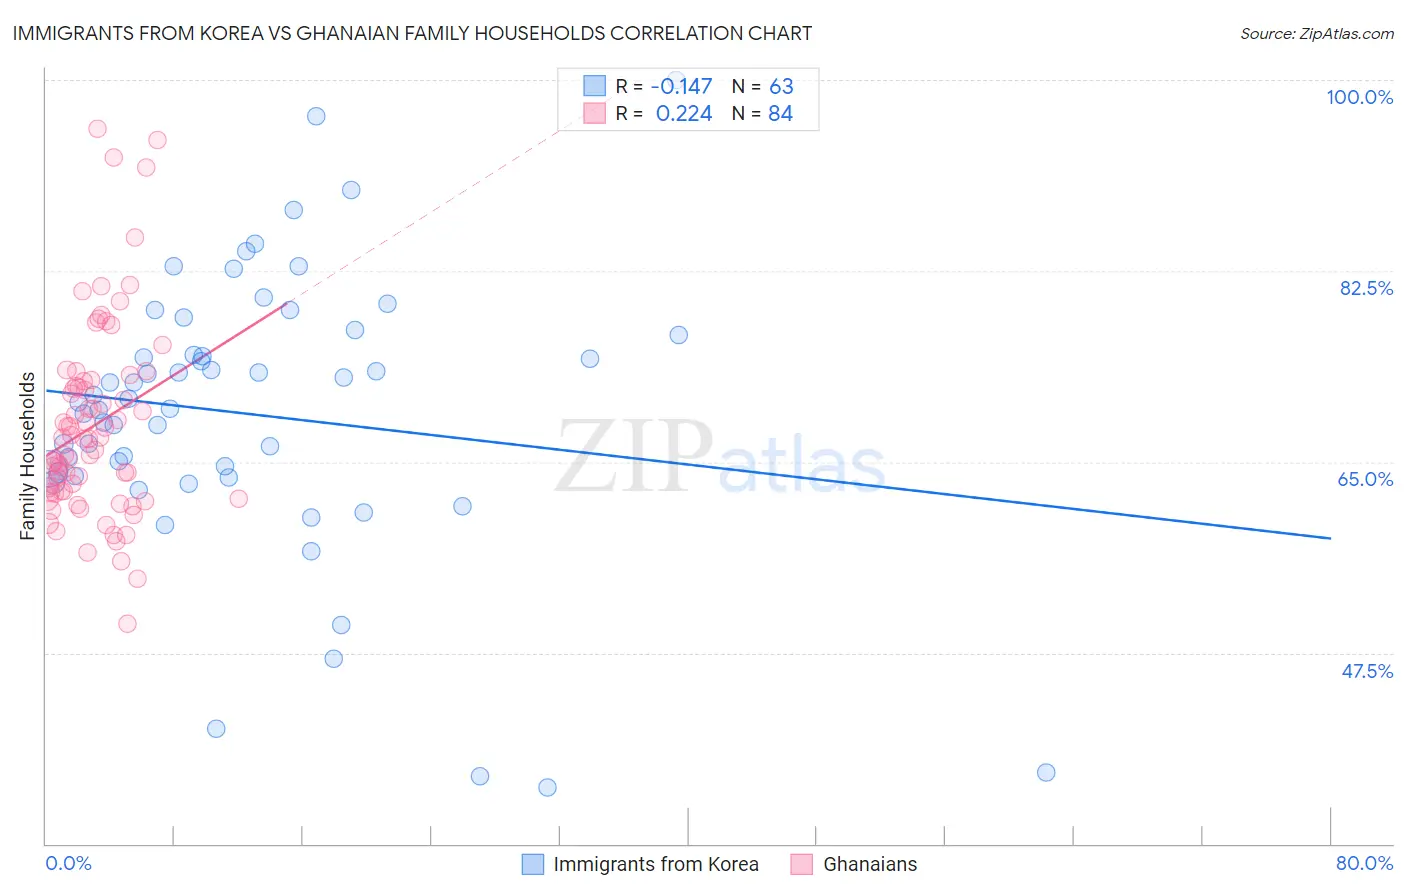
Immigrants from Korea vs Ghanaian Family Households Correlation Chart
The statistical analysis conducted on geographies consisting of 415,966,940 people shows a poor negative correlation between the proportion of Immigrants from Korea and percentage of family households in the United States with a correlation coefficient (R) of -0.147 and weighted average of 66.0%. Similarly, the statistical analysis conducted on geographies consisting of 190,523,422 people shows a weak positive correlation between the proportion of Ghanaians and percentage of family households in the United States with a correlation coefficient (R) of 0.224 and weighted average of 63.5%, a difference of 4.1%.
Family Households Correlation Summary
| Measurement | Immigrants from Korea | Ghanaian |
| Minimum | 35.2% | 50.2% |
| Maximum | 100.0% | 95.6% |
| Range | 64.8% | 45.4% |
| Mean | 69.4% | 68.3% |
| Median | 70.4% | 67.1% |
| Interquartile 25% (IQ1) | 63.7% | 62.3% |
| Interquartile 75% (IQ3) | 76.6% | 72.1% |
| Interquartile Range (IQR) | 12.9% | 9.9% |
| Standard Deviation (Sample) | 12.8% | 8.9% |
| Standard Deviation (Population) | 12.7% | 8.8% |
Similar Demographics by Family Households
Demographics Similar to Immigrants from Korea by Family Households
In terms of family households, the demographic groups most similar to Immigrants from Korea are South American (66.0%, a difference of 0.010%), Immigrants from Asia (66.1%, a difference of 0.020%), Danish (66.0%, a difference of 0.030%), Central American (66.0%, a difference of 0.060%), and Immigrants from Indonesia (66.0%, a difference of 0.10%).
| Demographics | Rating | Rank | Family Households |
| Colombians | 100.0 /100 | #52 | Exceptional 66.3% |
| Afghans | 100.0 /100 | #53 | Exceptional 66.3% |
| Immigrants | Colombia | 100.0 /100 | #54 | Exceptional 66.3% |
| Immigrants | Immigrants | 100.0 /100 | #55 | Exceptional 66.1% |
| Immigrants | Hong Kong | 100.0 /100 | #56 | Exceptional 66.1% |
| Pennsylvania Germans | 100.0 /100 | #57 | Exceptional 66.1% |
| Immigrants | Asia | 100.0 /100 | #58 | Exceptional 66.1% |
| Immigrants | Korea | 100.0 /100 | #59 | Exceptional 66.0% |
| South Americans | 100.0 /100 | #60 | Exceptional 66.0% |
| Danes | 100.0 /100 | #61 | Exceptional 66.0% |
| Central Americans | 100.0 /100 | #62 | Exceptional 66.0% |
| Immigrants | Indonesia | 100.0 /100 | #63 | Exceptional 66.0% |
| Pima | 99.9 /100 | #64 | Exceptional 65.9% |
| Costa Ricans | 99.9 /100 | #65 | Exceptional 65.9% |
| Fijians | 99.9 /100 | #66 | Exceptional 65.9% |
Demographics Similar to Ghanaians by Family Households
In terms of family households, the demographic groups most similar to Ghanaians are Comanche (63.5%, a difference of 0.0%), Albanian (63.5%, a difference of 0.010%), Immigrants from Zimbabwe (63.5%, a difference of 0.010%), Finnish (63.5%, a difference of 0.040%), and Aleut (63.4%, a difference of 0.040%).
| Demographics | Rating | Rank | Family Households |
| Bulgarians | 3.4 /100 | #229 | Tragic 63.6% |
| Immigrants | Brazil | 3.0 /100 | #230 | Tragic 63.6% |
| Immigrants | Greece | 2.9 /100 | #231 | Tragic 63.5% |
| Immigrants | Northern Africa | 2.6 /100 | #232 | Tragic 63.5% |
| Immigrants | Armenia | 2.6 /100 | #233 | Tragic 63.5% |
| Finns | 2.3 /100 | #234 | Tragic 63.5% |
| Albanians | 2.2 /100 | #235 | Tragic 63.5% |
| Ghanaians | 2.1 /100 | #236 | Tragic 63.5% |
| Comanche | 2.1 /100 | #237 | Tragic 63.5% |
| Immigrants | Zimbabwe | 2.0 /100 | #238 | Tragic 63.5% |
| Aleuts | 1.9 /100 | #239 | Tragic 63.4% |
| South Africans | 1.9 /100 | #240 | Tragic 63.4% |
| Immigrants | St. Vincent and the Grenadines | 1.9 /100 | #241 | Tragic 63.4% |
| Immigrants | Israel | 1.8 /100 | #242 | Tragic 63.4% |
| Immigrants | Czechoslovakia | 1.8 /100 | #243 | Tragic 63.4% |