Immigrants from Korea vs Sioux Family Households
COMPARE
Immigrants from Korea
Sioux
Family Households
Family Households Comparison
Immigrants from Korea
Sioux
66.0%
FAMILY HOUSEHOLDS
100.0/ 100
METRIC RATING
59th/ 347
METRIC RANK
64.6%
FAMILY HOUSEHOLDS
76.3/ 100
METRIC RATING
149th/ 347
METRIC RANK
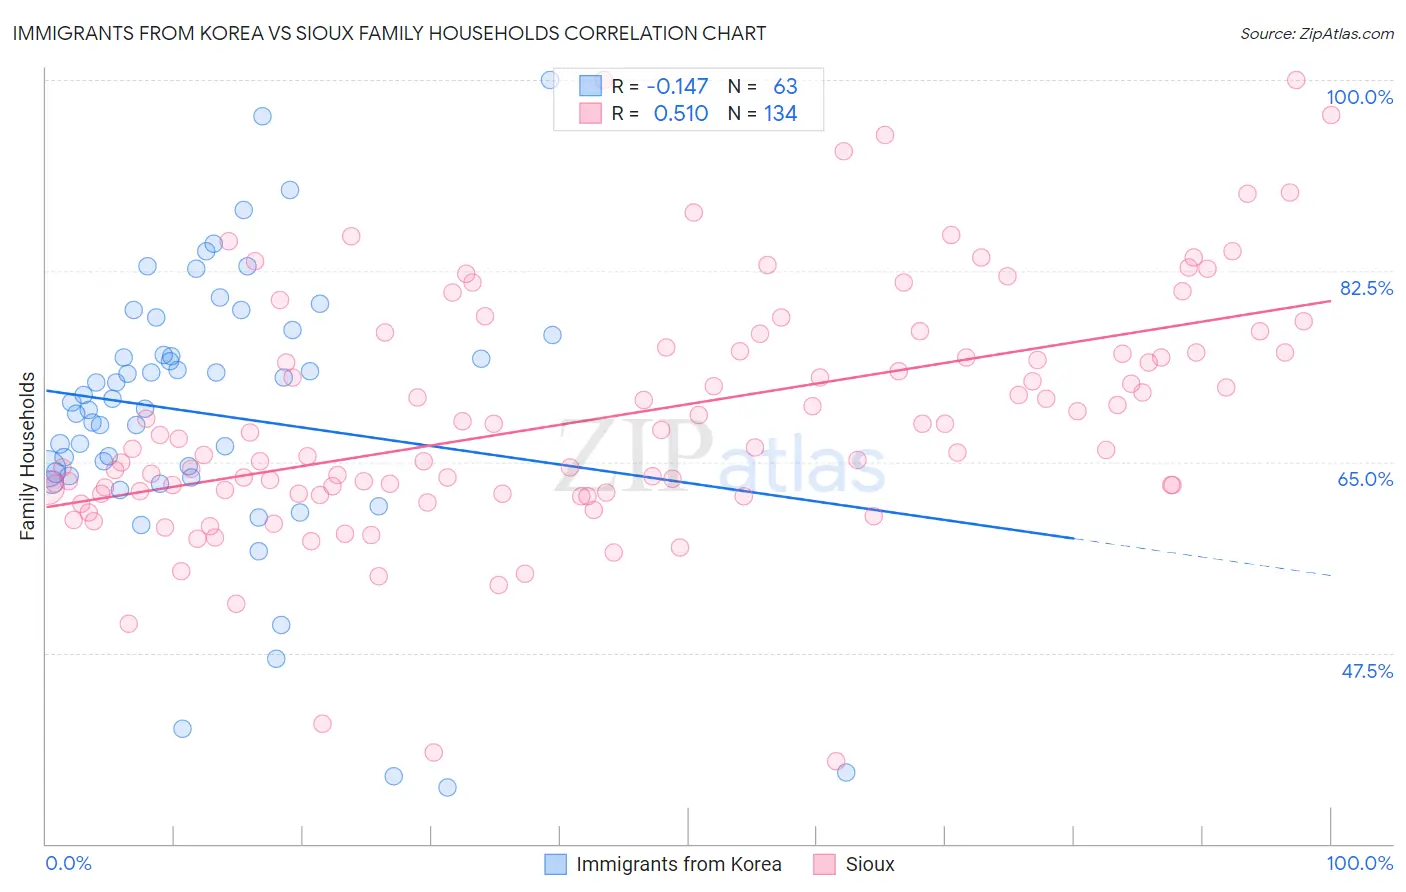
Immigrants from Korea vs Sioux Family Households Correlation Chart
The statistical analysis conducted on geographies consisting of 415,966,940 people shows a poor negative correlation between the proportion of Immigrants from Korea and percentage of family households in the United States with a correlation coefficient (R) of -0.147 and weighted average of 66.0%. Similarly, the statistical analysis conducted on geographies consisting of 234,114,463 people shows a substantial positive correlation between the proportion of Sioux and percentage of family households in the United States with a correlation coefficient (R) of 0.510 and weighted average of 64.6%, a difference of 2.3%.
Family Households Correlation Summary
| Measurement | Immigrants from Korea | Sioux |
| Minimum | 35.2% | 37.6% |
| Maximum | 100.0% | 100.0% |
| Range | 64.8% | 62.4% |
| Mean | 69.4% | 69.1% |
| Median | 70.4% | 66.7% |
| Interquartile 25% (IQ1) | 63.7% | 62.2% |
| Interquartile 75% (IQ3) | 76.6% | 75.2% |
| Interquartile Range (IQR) | 12.9% | 13.0% |
| Standard Deviation (Sample) | 12.8% | 11.2% |
| Standard Deviation (Population) | 12.7% | 11.1% |
Similar Demographics by Family Households
Demographics Similar to Immigrants from Korea by Family Households
In terms of family households, the demographic groups most similar to Immigrants from Korea are South American (66.0%, a difference of 0.010%), Immigrants from Asia (66.1%, a difference of 0.020%), Danish (66.0%, a difference of 0.030%), Central American (66.0%, a difference of 0.060%), and Immigrants from Indonesia (66.0%, a difference of 0.10%).
| Demographics | Rating | Rank | Family Households |
| Colombians | 100.0 /100 | #52 | Exceptional 66.3% |
| Afghans | 100.0 /100 | #53 | Exceptional 66.3% |
| Immigrants | Colombia | 100.0 /100 | #54 | Exceptional 66.3% |
| Immigrants | Immigrants | 100.0 /100 | #55 | Exceptional 66.1% |
| Immigrants | Hong Kong | 100.0 /100 | #56 | Exceptional 66.1% |
| Pennsylvania Germans | 100.0 /100 | #57 | Exceptional 66.1% |
| Immigrants | Asia | 100.0 /100 | #58 | Exceptional 66.1% |
| Immigrants | Korea | 100.0 /100 | #59 | Exceptional 66.0% |
| South Americans | 100.0 /100 | #60 | Exceptional 66.0% |
| Danes | 100.0 /100 | #61 | Exceptional 66.0% |
| Central Americans | 100.0 /100 | #62 | Exceptional 66.0% |
| Immigrants | Indonesia | 100.0 /100 | #63 | Exceptional 66.0% |
| Pima | 99.9 /100 | #64 | Exceptional 65.9% |
| Costa Ricans | 99.9 /100 | #65 | Exceptional 65.9% |
| Fijians | 99.9 /100 | #66 | Exceptional 65.9% |
Demographics Similar to Sioux by Family Households
In terms of family households, the demographic groups most similar to Sioux are Immigrants from Chile (64.6%, a difference of 0.0%), Delaware (64.6%, a difference of 0.0%), Immigrants from Romania (64.6%, a difference of 0.010%), Romanian (64.5%, a difference of 0.020%), and Syrian (64.5%, a difference of 0.020%).
| Demographics | Rating | Rank | Family Households |
| Pakistanis | 84.0 /100 | #142 | Excellent 64.7% |
| Czechoslovakians | 82.1 /100 | #143 | Excellent 64.6% |
| South American Indians | 81.9 /100 | #144 | Excellent 64.6% |
| Welsh | 80.1 /100 | #145 | Excellent 64.6% |
| Immigrants | Romania | 77.0 /100 | #146 | Good 64.6% |
| Immigrants | Chile | 76.5 /100 | #147 | Good 64.6% |
| Delaware | 76.3 /100 | #148 | Good 64.6% |
| Sioux | 76.3 /100 | #149 | Good 64.6% |
| Romanians | 75.3 /100 | #150 | Good 64.5% |
| Syrians | 75.2 /100 | #151 | Good 64.5% |
| Scottish | 70.9 /100 | #152 | Good 64.5% |
| Swedes | 69.8 /100 | #153 | Good 64.5% |
| Austrians | 68.5 /100 | #154 | Good 64.5% |
| Uruguayans | 67.7 /100 | #155 | Good 64.5% |
| Czechs | 67.0 /100 | #156 | Good 64.5% |