Immigrants from Korea vs Ghanaian Nursery School
COMPARE
Immigrants from Korea
Ghanaian
Nursery School
Nursery School Comparison
Immigrants from Korea
Ghanaians
98.0%
NURSERY SCHOOL
53.8/ 100
METRIC RATING
169th/ 347
METRIC RANK
97.5%
NURSERY SCHOOL
0.1/ 100
METRIC RATING
275th/ 347
METRIC RANK
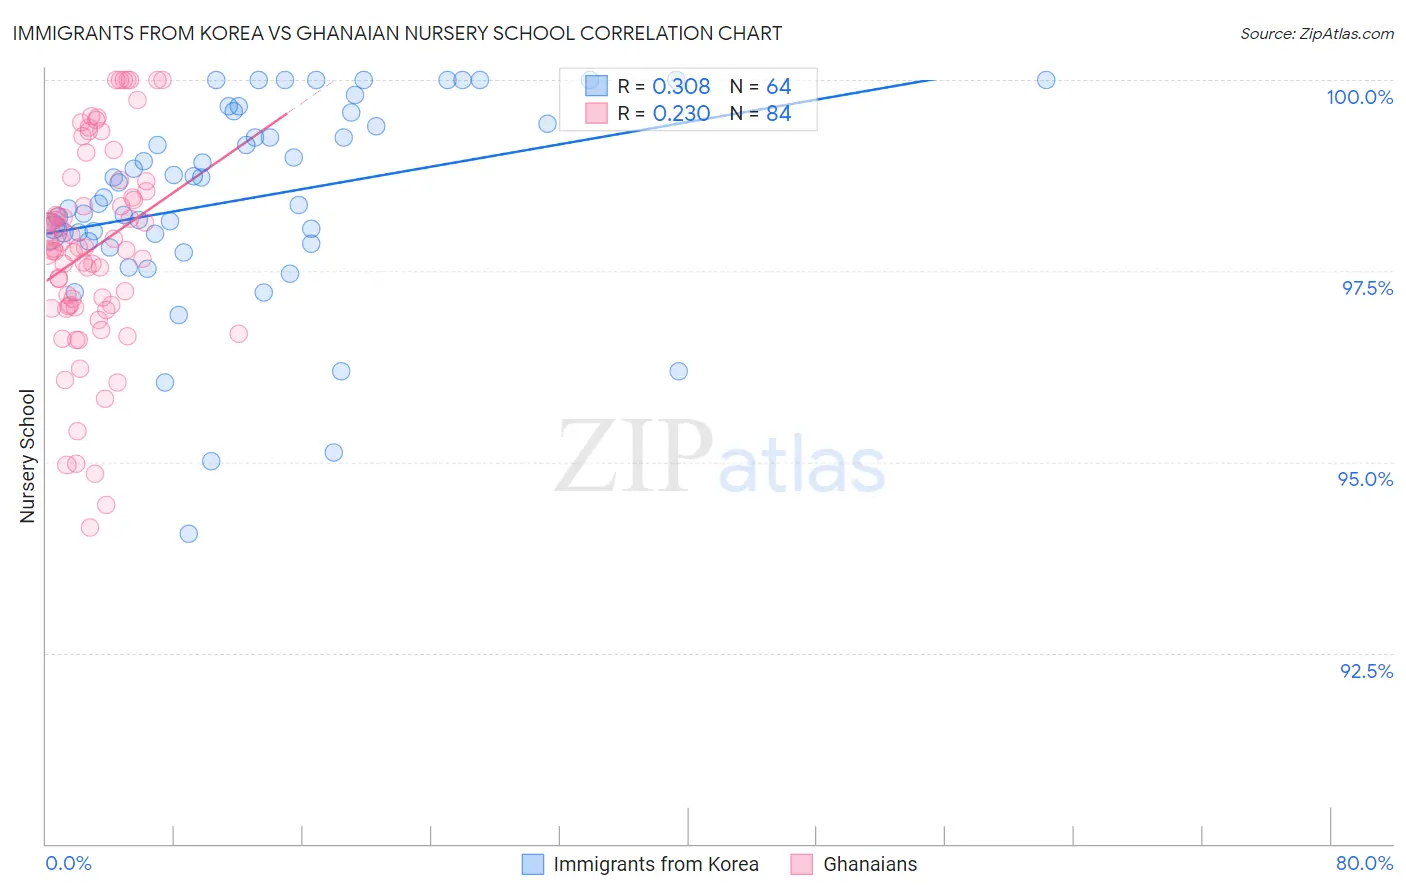
Immigrants from Korea vs Ghanaian Nursery School Correlation Chart
The statistical analysis conducted on geographies consisting of 416,280,076 people shows a mild positive correlation between the proportion of Immigrants from Korea and percentage of population with at least nursery school education in the United States with a correlation coefficient (R) of 0.308 and weighted average of 98.0%. Similarly, the statistical analysis conducted on geographies consisting of 190,712,873 people shows a weak positive correlation between the proportion of Ghanaians and percentage of population with at least nursery school education in the United States with a correlation coefficient (R) of 0.230 and weighted average of 97.5%, a difference of 0.53%.
Nursery School Correlation Summary
| Measurement | Immigrants from Korea | Ghanaian |
| Minimum | 94.1% | 94.1% |
| Maximum | 100.0% | 100.0% |
| Range | 5.9% | 5.9% |
| Mean | 98.5% | 97.8% |
| Median | 98.6% | 97.8% |
| Interquartile 25% (IQ1) | 97.9% | 97.0% |
| Interquartile 75% (IQ3) | 99.5% | 98.6% |
| Interquartile Range (IQR) | 1.6% | 1.6% |
| Standard Deviation (Sample) | 1.3% | 1.3% |
| Standard Deviation (Population) | 1.3% | 1.3% |
Similar Demographics by Nursery School
Demographics Similar to Immigrants from Korea by Nursery School
In terms of nursery school, the demographic groups most similar to Immigrants from Korea are Immigrants from Micronesia (98.0%, a difference of 0.0%), Bermudan (98.0%, a difference of 0.0%), Immigrants from Jordan (98.0%, a difference of 0.0%), Ugandan (98.0%, a difference of 0.010%), and Chilean (98.0%, a difference of 0.010%).
| Demographics | Rating | Rank | Nursery School |
| Brazilians | 59.4 /100 | #162 | Average 98.0% |
| Immigrants | Italy | 59.0 /100 | #163 | Average 98.0% |
| Ugandans | 56.4 /100 | #164 | Average 98.0% |
| Chileans | 56.4 /100 | #165 | Average 98.0% |
| Spanish Americans | 55.6 /100 | #166 | Average 98.0% |
| Immigrants | Spain | 55.6 /100 | #167 | Average 98.0% |
| Immigrants | Micronesia | 55.0 /100 | #168 | Average 98.0% |
| Immigrants | Korea | 53.8 /100 | #169 | Average 98.0% |
| Bermudans | 53.7 /100 | #170 | Average 98.0% |
| Immigrants | Jordan | 53.4 /100 | #171 | Average 98.0% |
| Immigrants | Brazil | 51.3 /100 | #172 | Average 98.0% |
| Kenyans | 50.2 /100 | #173 | Average 98.0% |
| Navajo | 50.0 /100 | #174 | Average 98.0% |
| Immigrants | Sri Lanka | 49.9 /100 | #175 | Average 98.0% |
| Immigrants | Venezuela | 49.8 /100 | #176 | Average 98.0% |
Demographics Similar to Ghanaians by Nursery School
In terms of nursery school, the demographic groups most similar to Ghanaians are Immigrants from China (97.5%, a difference of 0.0%), Immigrants from Cameroon (97.5%, a difference of 0.0%), Immigrants from Bolivia (97.5%, a difference of 0.020%), Immigrants from Philippines (97.5%, a difference of 0.020%), and Immigrants from Western Africa (97.4%, a difference of 0.030%).
| Demographics | Rating | Rank | Nursery School |
| West Indians | 0.3 /100 | #268 | Tragic 97.5% |
| Immigrants | Liberia | 0.3 /100 | #269 | Tragic 97.5% |
| Immigrants | Jamaica | 0.2 /100 | #270 | Tragic 97.5% |
| Immigrants | Peru | 0.2 /100 | #271 | Tragic 97.5% |
| Immigrants | Bolivia | 0.1 /100 | #272 | Tragic 97.5% |
| Immigrants | China | 0.1 /100 | #273 | Tragic 97.5% |
| Immigrants | Cameroon | 0.1 /100 | #274 | Tragic 97.5% |
| Ghanaians | 0.1 /100 | #275 | Tragic 97.5% |
| Immigrants | Philippines | 0.1 /100 | #276 | Tragic 97.5% |
| Immigrants | Western Africa | 0.1 /100 | #277 | Tragic 97.4% |
| Immigrants | Uzbekistan | 0.1 /100 | #278 | Tragic 97.4% |
| Immigrants | Ghana | 0.1 /100 | #279 | Tragic 97.4% |
| Barbadians | 0.0 /100 | #280 | Tragic 97.4% |
| Trinidadians and Tobagonians | 0.0 /100 | #281 | Tragic 97.4% |
| Afghans | 0.0 /100 | #282 | Tragic 97.4% |