Immigrants from Jordan vs South American Indian Single Father Households
COMPARE
Immigrants from Jordan
South American Indian
Single Father Households
Single Father Households Comparison
Immigrants from Jordan
South American Indians
2.2%
SINGLE FATHER HOUSEHOLDS
96.6/ 100
METRIC RATING
131st/ 347
METRIC RANK
2.3%
SINGLE FATHER HOUSEHOLDS
88.5/ 100
METRIC RATING
148th/ 347
METRIC RANK
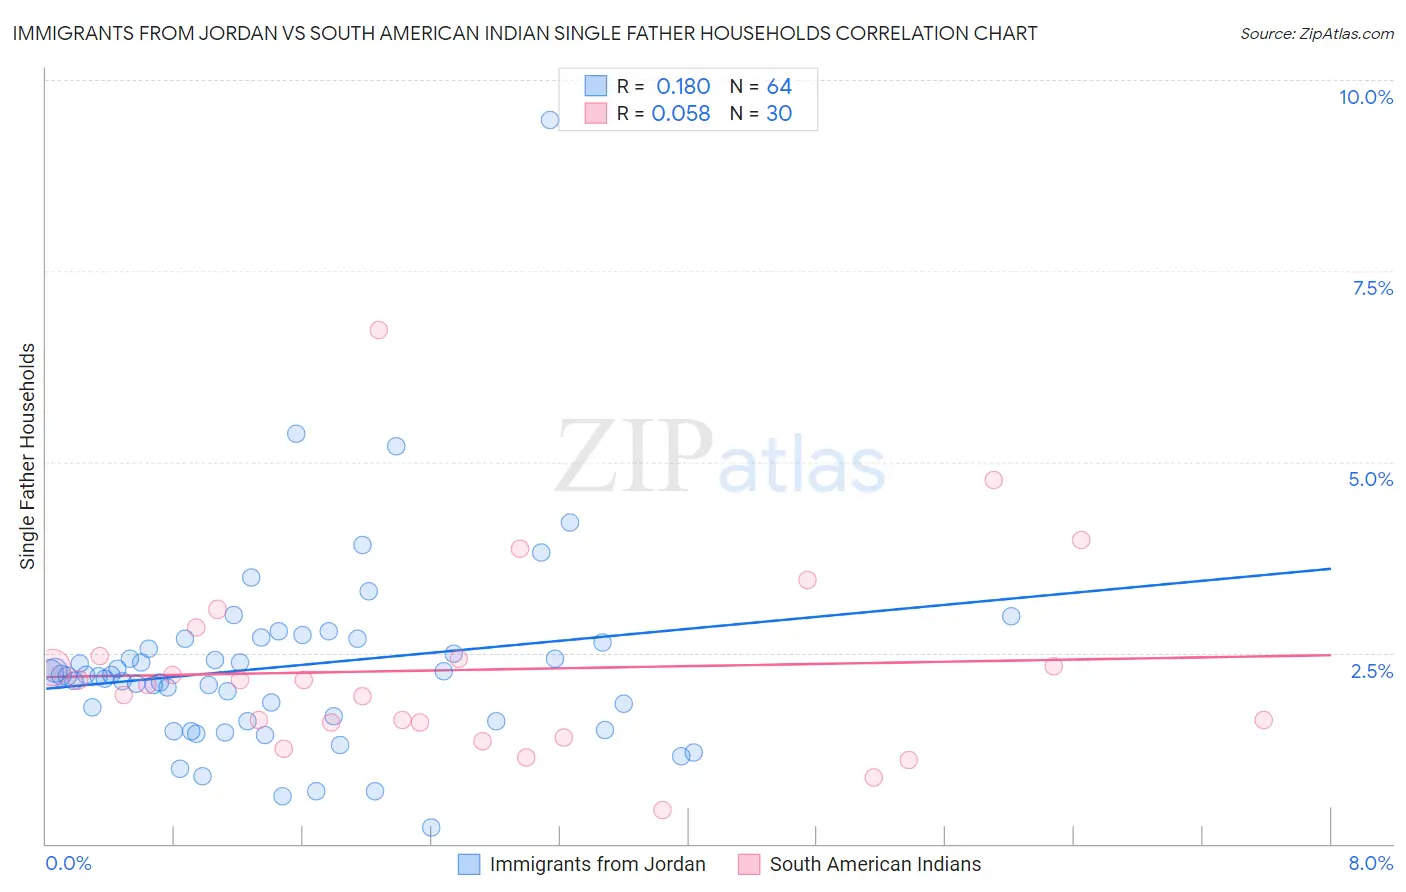
Immigrants from Jordan vs South American Indian Single Father Households Correlation Chart
The statistical analysis conducted on geographies consisting of 180,756,451 people shows a poor positive correlation between the proportion of Immigrants from Jordan and percentage of single father households in the United States with a correlation coefficient (R) of 0.180 and weighted average of 2.2%. Similarly, the statistical analysis conducted on geographies consisting of 164,166,551 people shows a slight positive correlation between the proportion of South American Indians and percentage of single father households in the United States with a correlation coefficient (R) of 0.058 and weighted average of 2.3%, a difference of 2.5%.
Single Father Households Correlation Summary
| Measurement | Immigrants from Jordan | South American Indian |
| Minimum | 0.21% | 0.43% |
| Maximum | 9.5% | 6.7% |
| Range | 9.3% | 6.3% |
| Mean | 2.3% | 2.3% |
| Median | 2.2% | 2.1% |
| Interquartile 25% (IQ1) | 1.6% | 1.6% |
| Interquartile 75% (IQ3) | 2.7% | 2.5% |
| Interquartile Range (IQR) | 1.1% | 0.87% |
| Standard Deviation (Sample) | 1.3% | 1.3% |
| Standard Deviation (Population) | 1.3% | 1.3% |
Demographics Similar to Immigrants from Jordan and South American Indians by Single Father Households
In terms of single father households, the demographic groups most similar to Immigrants from Jordan are Polish (2.2%, a difference of 0.020%), Immigrants from Chile (2.2%, a difference of 0.060%), Taiwanese (2.2%, a difference of 0.13%), Serbian (2.2%, a difference of 0.17%), and Zimbabwean (2.2%, a difference of 0.73%). Similarly, the demographic groups most similar to South American Indians are Senegalese (2.3%, a difference of 0.010%), Slavic (2.2%, a difference of 0.090%), Northern European (2.2%, a difference of 0.27%), Immigrants from Zimbabwe (2.2%, a difference of 0.35%), and Slovak (2.2%, a difference of 0.46%).
| Demographics | Rating | Rank | Single Father Households |
| Serbians | 96.8 /100 | #129 | Exceptional 2.2% |
| Immigrants | Chile | 96.7 /100 | #130 | Exceptional 2.2% |
| Immigrants | Jordan | 96.6 /100 | #131 | Exceptional 2.2% |
| Poles | 96.5 /100 | #132 | Exceptional 2.2% |
| Taiwanese | 96.3 /100 | #133 | Exceptional 2.2% |
| Zimbabweans | 95.1 /100 | #134 | Exceptional 2.2% |
| Syrians | 94.8 /100 | #135 | Exceptional 2.2% |
| Chileans | 94.5 /100 | #136 | Exceptional 2.2% |
| Austrians | 94.2 /100 | #137 | Exceptional 2.2% |
| West Indians | 94.1 /100 | #138 | Exceptional 2.2% |
| Brazilians | 92.8 /100 | #139 | Exceptional 2.2% |
| British | 92.8 /100 | #140 | Exceptional 2.2% |
| Laotians | 92.5 /100 | #141 | Exceptional 2.2% |
| Luxembourgers | 92.3 /100 | #142 | Exceptional 2.2% |
| Immigrants | Nepal | 92.1 /100 | #143 | Exceptional 2.2% |
| Slovaks | 90.7 /100 | #144 | Exceptional 2.2% |
| Immigrants | Zimbabwe | 90.2 /100 | #145 | Exceptional 2.2% |
| Northern Europeans | 89.8 /100 | #146 | Excellent 2.2% |
| Slavs | 88.9 /100 | #147 | Excellent 2.2% |
| South American Indians | 88.5 /100 | #148 | Excellent 2.3% |
| Senegalese | 88.4 /100 | #149 | Excellent 2.3% |