Canadian vs South American Indian Single Father Households
COMPARE
Canadian
South American Indian
Single Father Households
Single Father Households Comparison
Canadians
South American Indians
2.3%
SINGLE FATHER HOUSEHOLDS
79.7/ 100
METRIC RATING
157th/ 347
METRIC RANK
2.3%
SINGLE FATHER HOUSEHOLDS
88.5/ 100
METRIC RATING
148th/ 347
METRIC RANK
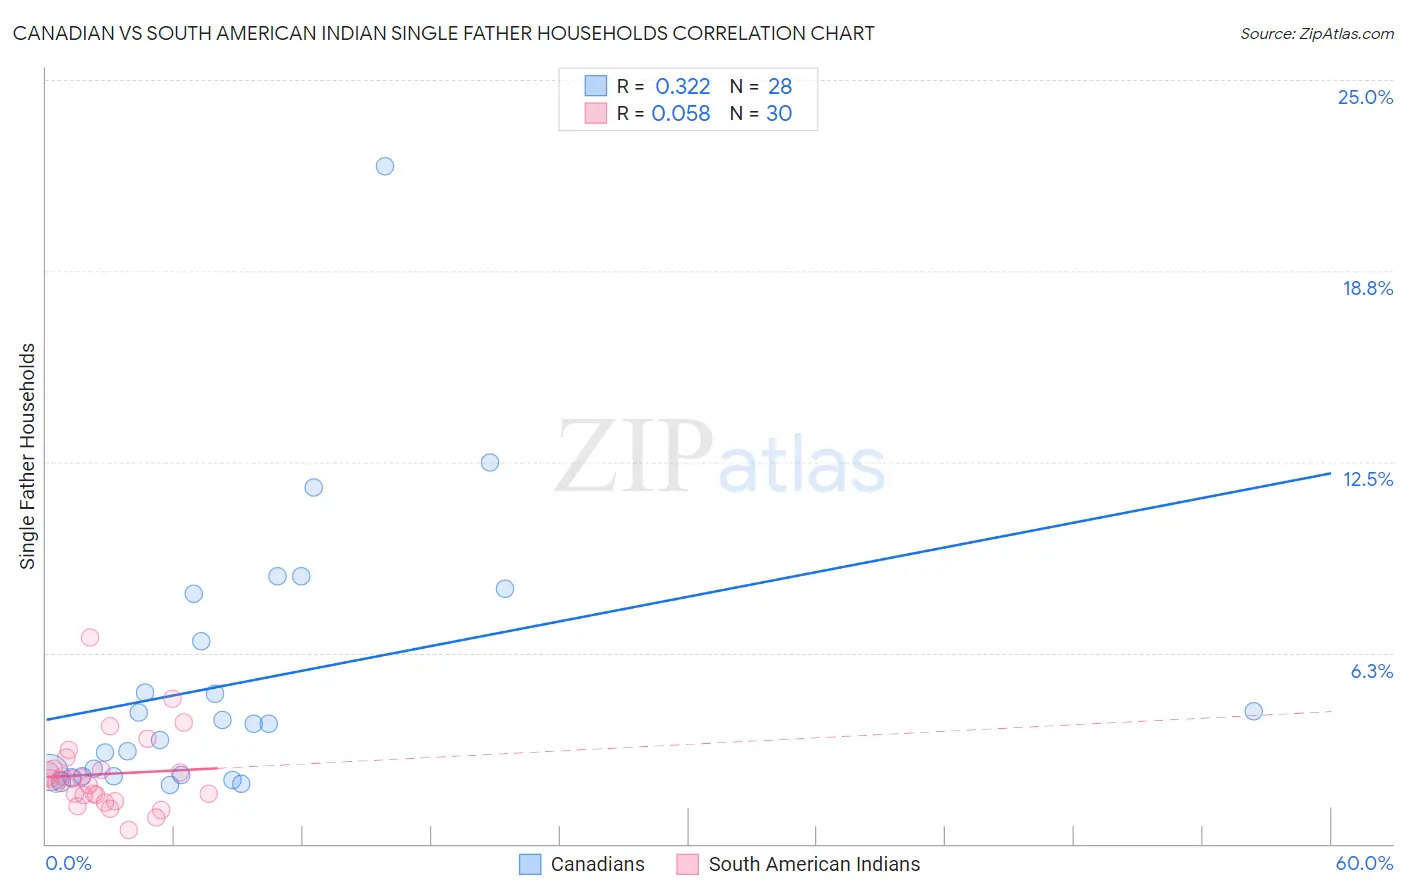
Canadian vs South American Indian Single Father Households Correlation Chart
The statistical analysis conducted on geographies consisting of 432,424,973 people shows a mild positive correlation between the proportion of Canadians and percentage of single father households in the United States with a correlation coefficient (R) of 0.322 and weighted average of 2.3%. Similarly, the statistical analysis conducted on geographies consisting of 164,166,551 people shows a slight positive correlation between the proportion of South American Indians and percentage of single father households in the United States with a correlation coefficient (R) of 0.058 and weighted average of 2.3%, a difference of 1.3%.
Single Father Households Correlation Summary
| Measurement | Canadian | South American Indian |
| Minimum | 1.9% | 0.43% |
| Maximum | 22.2% | 6.7% |
| Range | 20.3% | 6.3% |
| Mean | 5.3% | 2.3% |
| Median | 3.9% | 2.1% |
| Interquartile 25% (IQ1) | 2.2% | 1.6% |
| Interquartile 75% (IQ3) | 7.4% | 2.5% |
| Interquartile Range (IQR) | 5.2% | 0.87% |
| Standard Deviation (Sample) | 4.5% | 1.3% |
| Standard Deviation (Population) | 4.4% | 1.3% |
Demographics Similar to Canadians and South American Indians by Single Father Households
In terms of single father households, the demographic groups most similar to Canadians are Immigrants from South America (2.3%, a difference of 0.020%), Immigrants from Senegal (2.3%, a difference of 0.030%), European (2.3%, a difference of 0.14%), Bolivian (2.3%, a difference of 0.16%), and Immigrants from West Indies (2.3%, a difference of 0.20%). Similarly, the demographic groups most similar to South American Indians are Senegalese (2.3%, a difference of 0.010%), Slavic (2.2%, a difference of 0.090%), Northern European (2.2%, a difference of 0.27%), Immigrants from Zimbabwe (2.2%, a difference of 0.35%), and Venezuelan (2.3%, a difference of 0.39%).
| Demographics | Rating | Rank | Single Father Households |
| Luxembourgers | 92.3 /100 | #142 | Exceptional 2.2% |
| Immigrants | Nepal | 92.1 /100 | #143 | Exceptional 2.2% |
| Slovaks | 90.7 /100 | #144 | Exceptional 2.2% |
| Immigrants | Zimbabwe | 90.2 /100 | #145 | Exceptional 2.2% |
| Northern Europeans | 89.8 /100 | #146 | Excellent 2.2% |
| Slavs | 88.9 /100 | #147 | Excellent 2.2% |
| South American Indians | 88.5 /100 | #148 | Excellent 2.3% |
| Senegalese | 88.4 /100 | #149 | Excellent 2.3% |
| Venezuelans | 86.2 /100 | #150 | Excellent 2.3% |
| Immigrants | Syria | 84.8 /100 | #151 | Excellent 2.3% |
| Immigrants | Venezuela | 83.2 /100 | #152 | Excellent 2.3% |
| Immigrants | Germany | 82.8 /100 | #153 | Excellent 2.3% |
| Bolivians | 81.0 /100 | #154 | Excellent 2.3% |
| Europeans | 80.9 /100 | #155 | Excellent 2.3% |
| Immigrants | South America | 79.9 /100 | #156 | Good 2.3% |
| Canadians | 79.7 /100 | #157 | Good 2.3% |
| Immigrants | Senegal | 79.4 /100 | #158 | Good 2.3% |
| Immigrants | West Indies | 77.9 /100 | #159 | Good 2.3% |
| Immigrants | Bolivia | 76.3 /100 | #160 | Good 2.3% |
| Swiss | 73.2 /100 | #161 | Good 2.3% |
| Scottish | 72.8 /100 | #162 | Good 2.3% |