Immigrants from Jordan vs Colombian Single Father Households
COMPARE
Immigrants from Jordan
Colombian
Single Father Households
Single Father Households Comparison
Immigrants from Jordan
Colombians
2.2%
SINGLE FATHER HOUSEHOLDS
96.6/ 100
METRIC RATING
131st/ 347
METRIC RANK
2.3%
SINGLE FATHER HOUSEHOLDS
48.0/ 100
METRIC RATING
177th/ 347
METRIC RANK
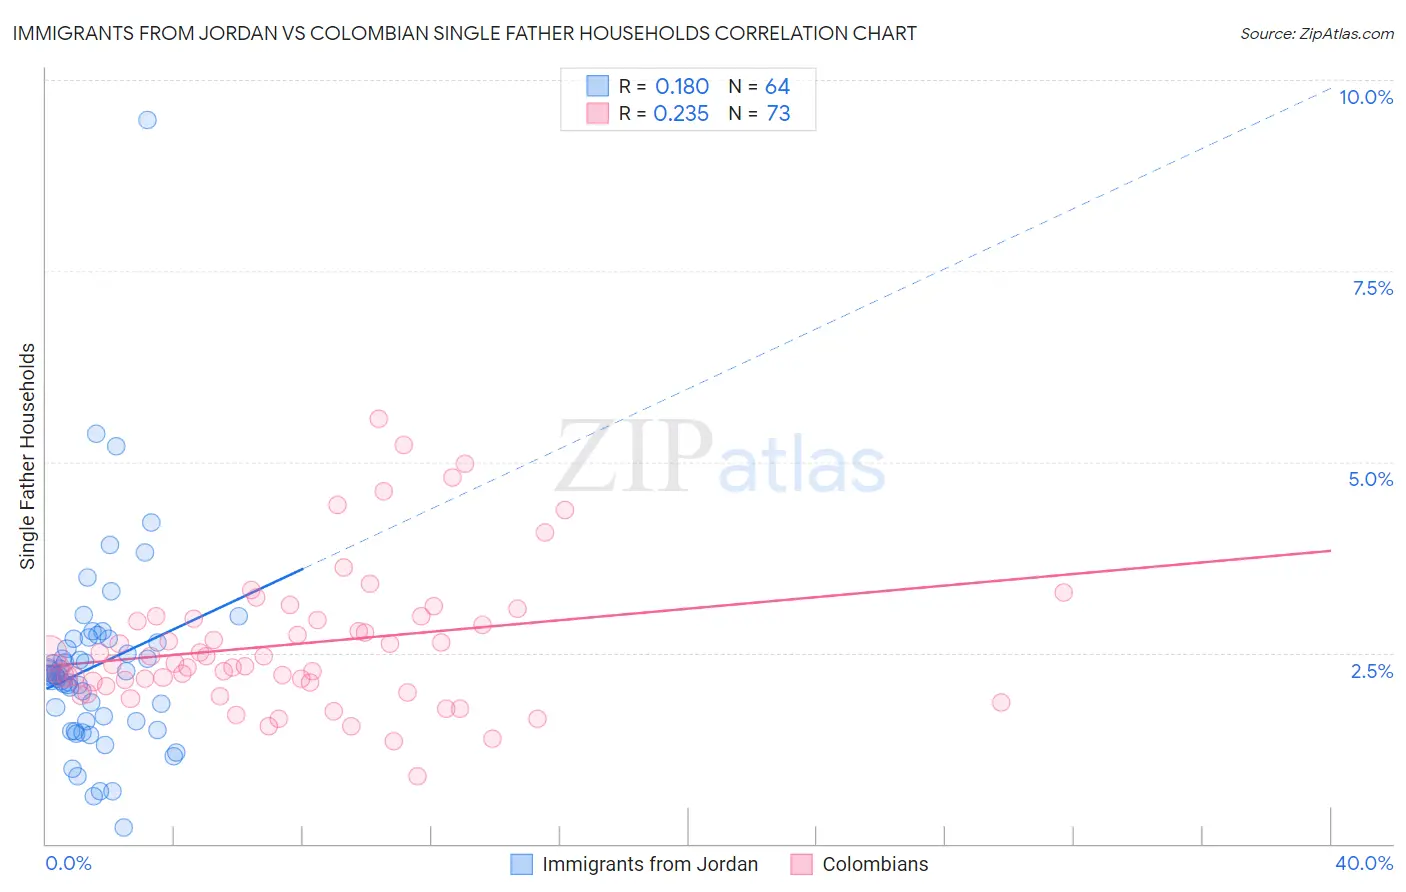
Immigrants from Jordan vs Colombian Single Father Households Correlation Chart
The statistical analysis conducted on geographies consisting of 180,756,451 people shows a poor positive correlation between the proportion of Immigrants from Jordan and percentage of single father households in the United States with a correlation coefficient (R) of 0.180 and weighted average of 2.2%. Similarly, the statistical analysis conducted on geographies consisting of 415,821,309 people shows a weak positive correlation between the proportion of Colombians and percentage of single father households in the United States with a correlation coefficient (R) of 0.235 and weighted average of 2.3%, a difference of 6.7%.
Single Father Households Correlation Summary
| Measurement | Immigrants from Jordan | Colombian |
| Minimum | 0.21% | 0.89% |
| Maximum | 9.5% | 5.6% |
| Range | 9.3% | 4.7% |
| Mean | 2.3% | 2.6% |
| Median | 2.2% | 2.4% |
| Interquartile 25% (IQ1) | 1.6% | 2.1% |
| Interquartile 75% (IQ3) | 2.7% | 3.0% |
| Interquartile Range (IQR) | 1.1% | 0.87% |
| Standard Deviation (Sample) | 1.3% | 0.93% |
| Standard Deviation (Population) | 1.3% | 0.92% |
Similar Demographics by Single Father Households
Demographics Similar to Immigrants from Jordan by Single Father Households
In terms of single father households, the demographic groups most similar to Immigrants from Jordan are Polish (2.2%, a difference of 0.020%), Immigrants from Chile (2.2%, a difference of 0.060%), Taiwanese (2.2%, a difference of 0.13%), Serbian (2.2%, a difference of 0.17%), and Immigrants from England (2.2%, a difference of 0.18%).
| Demographics | Rating | Rank | Single Father Households |
| British West Indians | 97.4 /100 | #124 | Exceptional 2.2% |
| Immigrants | Indonesia | 97.4 /100 | #125 | Exceptional 2.2% |
| Moroccans | 96.9 /100 | #126 | Exceptional 2.2% |
| Jordanians | 96.9 /100 | #127 | Exceptional 2.2% |
| Immigrants | England | 96.8 /100 | #128 | Exceptional 2.2% |
| Serbians | 96.8 /100 | #129 | Exceptional 2.2% |
| Immigrants | Chile | 96.7 /100 | #130 | Exceptional 2.2% |
| Immigrants | Jordan | 96.6 /100 | #131 | Exceptional 2.2% |
| Poles | 96.5 /100 | #132 | Exceptional 2.2% |
| Taiwanese | 96.3 /100 | #133 | Exceptional 2.2% |
| Zimbabweans | 95.1 /100 | #134 | Exceptional 2.2% |
| Syrians | 94.8 /100 | #135 | Exceptional 2.2% |
| Chileans | 94.5 /100 | #136 | Exceptional 2.2% |
| Austrians | 94.2 /100 | #137 | Exceptional 2.2% |
| West Indians | 94.1 /100 | #138 | Exceptional 2.2% |
Demographics Similar to Colombians by Single Father Households
In terms of single father households, the demographic groups most similar to Colombians are Danish (2.3%, a difference of 0.010%), Immigrants from Jamaica (2.3%, a difference of 0.080%), Afghan (2.3%, a difference of 0.14%), Costa Rican (2.3%, a difference of 0.29%), and Welsh (2.3%, a difference of 0.30%).
| Demographics | Rating | Rank | Single Father Households |
| Ugandans | 62.2 /100 | #170 | Good 2.3% |
| Swedes | 61.6 /100 | #171 | Good 2.3% |
| Czechoslovakians | 58.9 /100 | #172 | Average 2.3% |
| Celtics | 55.4 /100 | #173 | Average 2.3% |
| Afghans | 50.0 /100 | #174 | Average 2.3% |
| Immigrants | Jamaica | 49.1 /100 | #175 | Average 2.3% |
| Danes | 48.2 /100 | #176 | Average 2.3% |
| Colombians | 48.0 /100 | #177 | Average 2.3% |
| Costa Ricans | 44.1 /100 | #178 | Average 2.3% |
| Welsh | 44.0 /100 | #179 | Average 2.3% |
| Yugoslavians | 43.9 /100 | #180 | Average 2.3% |
| Jamaicans | 43.5 /100 | #181 | Average 2.3% |
| Belgians | 43.3 /100 | #182 | Average 2.3% |
| Immigrants | Panama | 41.8 /100 | #183 | Average 2.4% |
| Sri Lankans | 41.8 /100 | #184 | Average 2.4% |