Immigrants from Jordan vs Immigrants from Taiwan Divorced or Separated
COMPARE
Immigrants from Jordan
Immigrants from Taiwan
Divorced or Separated
Divorced or Separated Comparison
Immigrants from Jordan
Immigrants from Taiwan
11.6%
DIVORCED OR SEPARATED
98.6/ 100
METRIC RATING
98th/ 347
METRIC RANK
9.8%
DIVORCED OR SEPARATED
100.0/ 100
METRIC RATING
1st/ 347
METRIC RANK
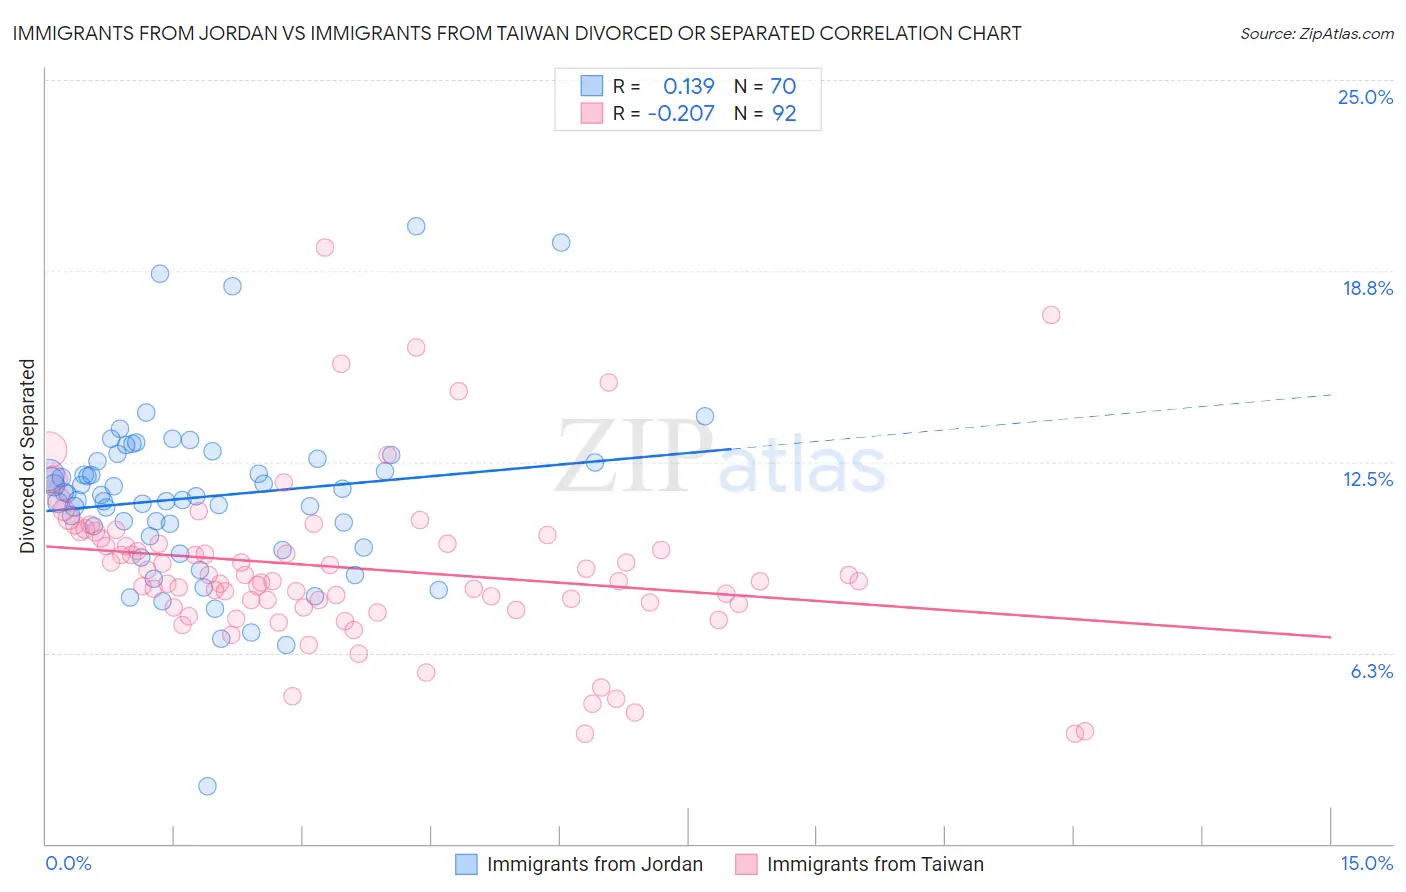
Immigrants from Jordan vs Immigrants from Taiwan Divorced or Separated Correlation Chart
The statistical analysis conducted on geographies consisting of 181,255,451 people shows a poor positive correlation between the proportion of Immigrants from Jordan and percentage of population currently divorced or separated in the United States with a correlation coefficient (R) of 0.139 and weighted average of 11.6%. Similarly, the statistical analysis conducted on geographies consisting of 298,143,360 people shows a weak negative correlation between the proportion of Immigrants from Taiwan and percentage of population currently divorced or separated in the United States with a correlation coefficient (R) of -0.207 and weighted average of 9.8%, a difference of 18.4%.
Divorced or Separated Correlation Summary
| Measurement | Immigrants from Jordan | Immigrants from Taiwan |
| Minimum | 1.9% | 3.6% |
| Maximum | 20.2% | 19.5% |
| Range | 18.3% | 15.9% |
| Mean | 11.3% | 9.0% |
| Median | 11.4% | 8.6% |
| Interquartile 25% (IQ1) | 10.1% | 7.8% |
| Interquartile 75% (IQ3) | 12.5% | 10.0% |
| Interquartile Range (IQR) | 2.4% | 2.2% |
| Standard Deviation (Sample) | 2.9% | 2.7% |
| Standard Deviation (Population) | 2.8% | 2.7% |
Similar Demographics by Divorced or Separated
Demographics Similar to Immigrants from Jordan by Divorced or Separated
In terms of divorced or separated, the demographic groups most similar to Immigrants from Jordan are Immigrants from Sweden (11.6%, a difference of 0.020%), Latvian (11.6%, a difference of 0.040%), Immigrants from Northern Europe (11.6%, a difference of 0.050%), Immigrants from Ukraine (11.6%, a difference of 0.060%), and Immigrants from Guyana (11.6%, a difference of 0.080%).
| Demographics | Rating | Rank | Divorced or Separated |
| Spanish American Indians | 99.0 /100 | #91 | Exceptional 11.6% |
| Immigrants | Denmark | 98.9 /100 | #92 | Exceptional 11.6% |
| Arabs | 98.9 /100 | #93 | Exceptional 11.6% |
| Immigrants | Fiji | 98.9 /100 | #94 | Exceptional 11.6% |
| Immigrants | Serbia | 98.8 /100 | #95 | Exceptional 11.6% |
| Immigrants | Ukraine | 98.7 /100 | #96 | Exceptional 11.6% |
| Latvians | 98.7 /100 | #97 | Exceptional 11.6% |
| Immigrants | Jordan | 98.6 /100 | #98 | Exceptional 11.6% |
| Immigrants | Sweden | 98.6 /100 | #99 | Exceptional 11.6% |
| Immigrants | Northern Europe | 98.6 /100 | #100 | Exceptional 11.6% |
| Immigrants | Guyana | 98.5 /100 | #101 | Exceptional 11.6% |
| Immigrants | Croatia | 98.3 /100 | #102 | Exceptional 11.6% |
| Maltese | 98.2 /100 | #103 | Exceptional 11.6% |
| Salvadorans | 98.2 /100 | #104 | Exceptional 11.6% |
| Immigrants | El Salvador | 97.9 /100 | #105 | Exceptional 11.7% |
Demographics Similar to Immigrants from Taiwan by Divorced or Separated
In terms of divorced or separated, the demographic groups most similar to Immigrants from Taiwan are Filipino (9.9%, a difference of 1.1%), Immigrants from Hong Kong (10.0%, a difference of 1.6%), Immigrants from China (10.0%, a difference of 2.4%), Immigrants from India (10.1%, a difference of 2.6%), and Indian (Asian) (10.2%, a difference of 4.0%).
| Demographics | Rating | Rank | Divorced or Separated |
| Immigrants | Taiwan | 100.0 /100 | #1 | Exceptional 9.8% |
| Filipinos | 100.0 /100 | #2 | Exceptional 9.9% |
| Immigrants | Hong Kong | 100.0 /100 | #3 | Exceptional 10.0% |
| Immigrants | China | 100.0 /100 | #4 | Exceptional 10.0% |
| Immigrants | India | 100.0 /100 | #5 | Exceptional 10.1% |
| Indians (Asian) | 100.0 /100 | #6 | Exceptional 10.2% |
| Thais | 100.0 /100 | #7 | Exceptional 10.2% |
| Immigrants | Eastern Asia | 100.0 /100 | #8 | Exceptional 10.2% |
| Yup'ik | 100.0 /100 | #9 | Exceptional 10.3% |
| Immigrants | Singapore | 100.0 /100 | #10 | Exceptional 10.3% |
| Immigrants | South Central Asia | 100.0 /100 | #11 | Exceptional 10.4% |
| Okinawans | 100.0 /100 | #12 | Exceptional 10.5% |
| Cypriots | 100.0 /100 | #13 | Exceptional 10.5% |
| Assyrians/Chaldeans/Syriacs | 100.0 /100 | #14 | Exceptional 10.6% |
| Immigrants | Armenia | 100.0 /100 | #15 | Exceptional 10.6% |