Chinese vs Colombian Single Father Households
COMPARE
Chinese
Colombian
Single Father Households
Single Father Households Comparison
Chinese
Colombians
2.0%
SINGLE FATHER HOUSEHOLDS
100.0/ 100
METRIC RATING
32nd/ 347
METRIC RANK
2.3%
SINGLE FATHER HOUSEHOLDS
48.0/ 100
METRIC RATING
177th/ 347
METRIC RANK
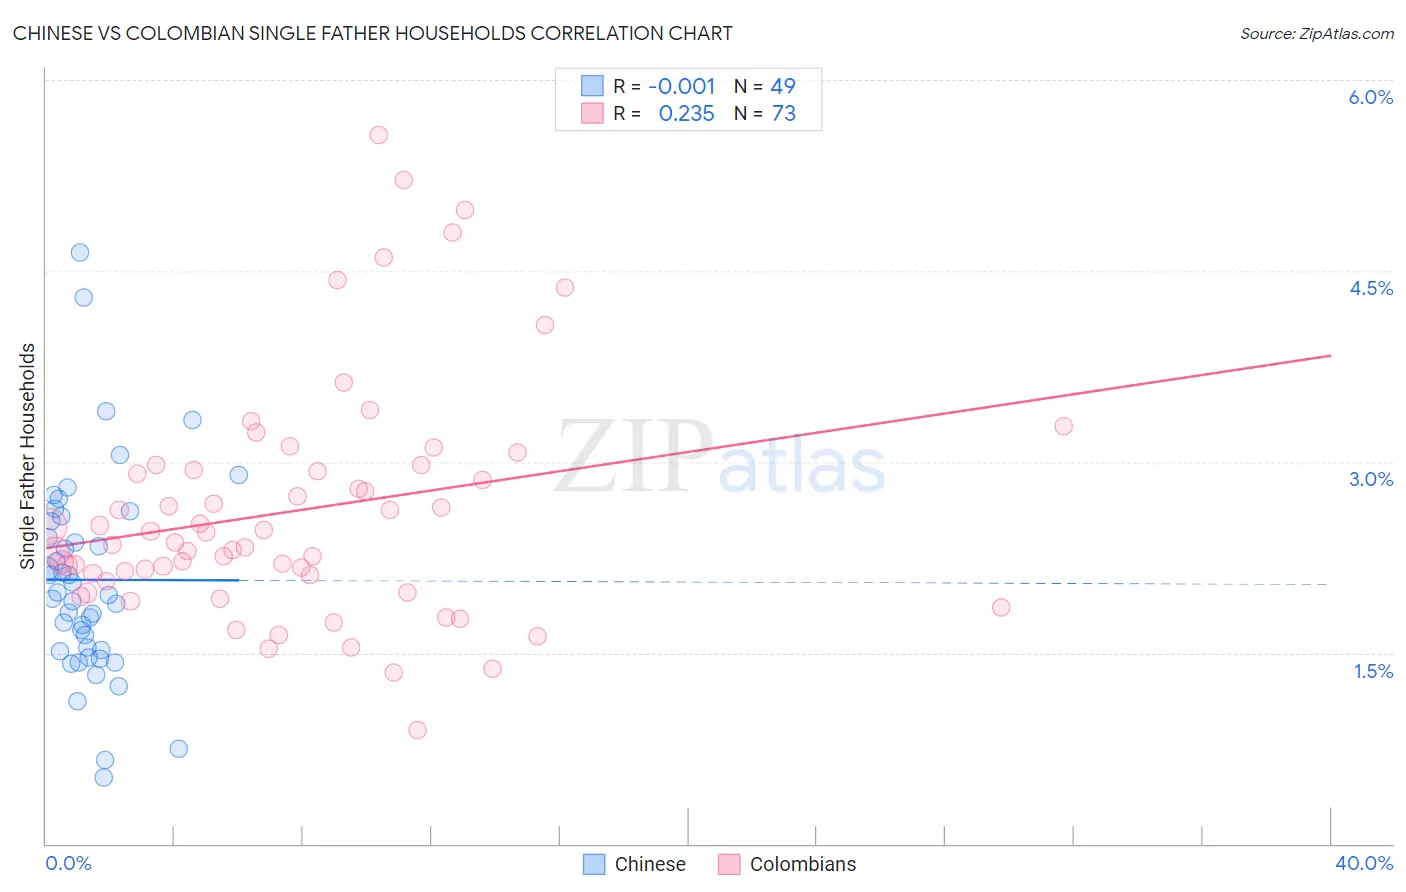
Chinese vs Colombian Single Father Households Correlation Chart
The statistical analysis conducted on geographies consisting of 64,726,791 people shows no correlation between the proportion of Chinese and percentage of single father households in the United States with a correlation coefficient (R) of -0.001 and weighted average of 2.0%. Similarly, the statistical analysis conducted on geographies consisting of 415,821,309 people shows a weak positive correlation between the proportion of Colombians and percentage of single father households in the United States with a correlation coefficient (R) of 0.235 and weighted average of 2.3%, a difference of 18.7%.
Single Father Households Correlation Summary
| Measurement | Chinese | Colombian |
| Minimum | 0.52% | 0.89% |
| Maximum | 4.6% | 5.6% |
| Range | 4.1% | 4.7% |
| Mean | 2.1% | 2.6% |
| Median | 2.0% | 2.4% |
| Interquartile 25% (IQ1) | 1.5% | 2.1% |
| Interquartile 75% (IQ3) | 2.6% | 3.0% |
| Interquartile Range (IQR) | 1.0% | 0.87% |
| Standard Deviation (Sample) | 0.81% | 0.93% |
| Standard Deviation (Population) | 0.80% | 0.92% |
Similar Demographics by Single Father Households
Demographics Similar to Chinese by Single Father Households
In terms of single father households, the demographic groups most similar to Chinese are Israeli (2.0%, a difference of 0.040%), Cambodian (2.0%, a difference of 0.070%), Bulgarian (2.0%, a difference of 0.090%), Immigrants from Japan (2.0%, a difference of 0.18%), and Turkish (2.0%, a difference of 0.21%).
| Demographics | Rating | Rank | Single Father Households |
| Eastern Europeans | 100.0 /100 | #25 | Exceptional 2.0% |
| Assyrians/Chaldeans/Syriacs | 100.0 /100 | #26 | Exceptional 2.0% |
| Immigrants | South Central Asia | 100.0 /100 | #27 | Exceptional 2.0% |
| Immigrants | Japan | 100.0 /100 | #28 | Exceptional 2.0% |
| Bulgarians | 100.0 /100 | #29 | Exceptional 2.0% |
| Cambodians | 100.0 /100 | #30 | Exceptional 2.0% |
| Israelis | 100.0 /100 | #31 | Exceptional 2.0% |
| Chinese | 100.0 /100 | #32 | Exceptional 2.0% |
| Turks | 100.0 /100 | #33 | Exceptional 2.0% |
| Immigrants | Australia | 100.0 /100 | #34 | Exceptional 2.0% |
| Albanians | 100.0 /100 | #35 | Exceptional 2.0% |
| Immigrants | Belgium | 100.0 /100 | #36 | Exceptional 2.0% |
| Immigrants | St. Vincent and the Grenadines | 100.0 /100 | #37 | Exceptional 2.0% |
| Immigrants | Eastern Europe | 100.0 /100 | #38 | Exceptional 2.0% |
| Immigrants | Sri Lanka | 100.0 /100 | #39 | Exceptional 2.0% |
Demographics Similar to Colombians by Single Father Households
In terms of single father households, the demographic groups most similar to Colombians are Danish (2.3%, a difference of 0.010%), Immigrants from Jamaica (2.3%, a difference of 0.080%), Afghan (2.3%, a difference of 0.14%), Costa Rican (2.3%, a difference of 0.29%), and Welsh (2.3%, a difference of 0.30%).
| Demographics | Rating | Rank | Single Father Households |
| Ugandans | 62.2 /100 | #170 | Good 2.3% |
| Swedes | 61.6 /100 | #171 | Good 2.3% |
| Czechoslovakians | 58.9 /100 | #172 | Average 2.3% |
| Celtics | 55.4 /100 | #173 | Average 2.3% |
| Afghans | 50.0 /100 | #174 | Average 2.3% |
| Immigrants | Jamaica | 49.1 /100 | #175 | Average 2.3% |
| Danes | 48.2 /100 | #176 | Average 2.3% |
| Colombians | 48.0 /100 | #177 | Average 2.3% |
| Costa Ricans | 44.1 /100 | #178 | Average 2.3% |
| Welsh | 44.0 /100 | #179 | Average 2.3% |
| Yugoslavians | 43.9 /100 | #180 | Average 2.3% |
| Jamaicans | 43.5 /100 | #181 | Average 2.3% |
| Belgians | 43.3 /100 | #182 | Average 2.3% |
| Immigrants | Panama | 41.8 /100 | #183 | Average 2.4% |
| Sri Lankans | 41.8 /100 | #184 | Average 2.4% |