Immigrants from Japan vs Uruguayan Family Households with Children
COMPARE
Immigrants from Japan
Uruguayan
Family Households with Children
Family Households with Children Comparison
Immigrants from Japan
Uruguayans
27.1%
FAMILY HOUSEHOLDS WITH CHILDREN
10.7/ 100
METRIC RATING
219th/ 347
METRIC RANK
27.7%
FAMILY HOUSEHOLDS WITH CHILDREN
83.2/ 100
METRIC RATING
138th/ 347
METRIC RANK
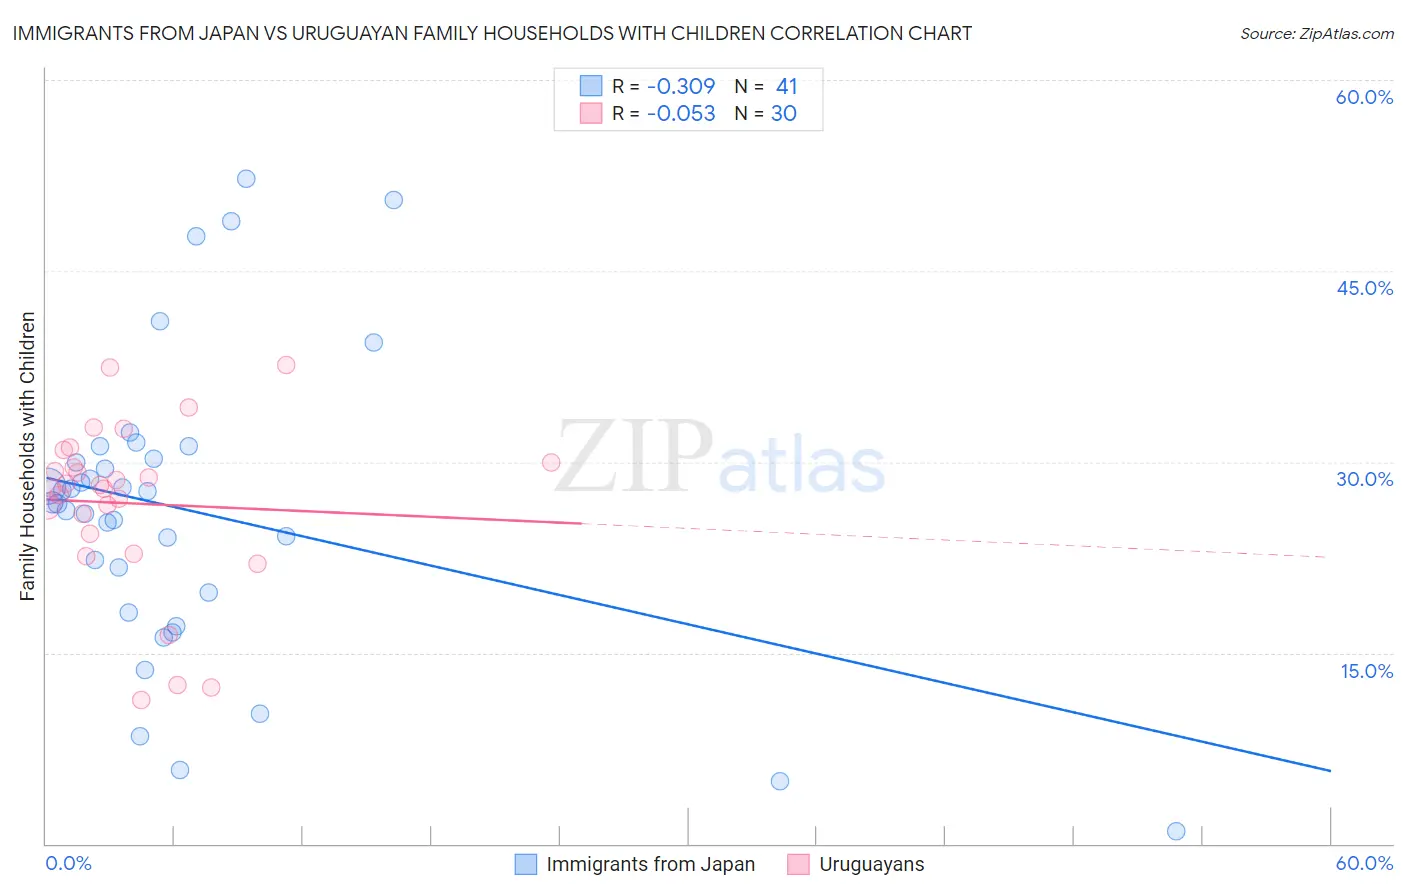
Immigrants from Japan vs Uruguayan Family Households with Children Correlation Chart
The statistical analysis conducted on geographies consisting of 339,902,345 people shows a mild negative correlation between the proportion of Immigrants from Japan and percentage of family households with children in the United States with a correlation coefficient (R) of -0.309 and weighted average of 27.1%. Similarly, the statistical analysis conducted on geographies consisting of 144,747,065 people shows a slight negative correlation between the proportion of Uruguayans and percentage of family households with children in the United States with a correlation coefficient (R) of -0.053 and weighted average of 27.7%, a difference of 2.1%.
Family Households with Children Correlation Summary
| Measurement | Immigrants from Japan | Uruguayan |
| Minimum | 1.0% | 11.3% |
| Maximum | 52.3% | 37.6% |
| Range | 51.3% | 26.4% |
| Mean | 26.2% | 26.7% |
| Median | 26.8% | 28.0% |
| Interquartile 25% (IQ1) | 19.0% | 24.4% |
| Interquartile 75% (IQ3) | 30.7% | 30.0% |
| Interquartile Range (IQR) | 11.7% | 5.6% |
| Standard Deviation (Sample) | 11.7% | 6.6% |
| Standard Deviation (Population) | 11.6% | 6.5% |
Similar Demographics by Family Households with Children
Demographics Similar to Immigrants from Japan by Family Households with Children
In terms of family households with children, the demographic groups most similar to Immigrants from Japan are Greek (27.1%, a difference of 0.040%), Austrian (27.1%, a difference of 0.050%), New Zealander (27.1%, a difference of 0.070%), Cuban (27.1%, a difference of 0.080%), and U.S. Virgin Islander (27.1%, a difference of 0.080%).
| Demographics | Rating | Rank | Family Households with Children |
| Immigrants | Dominica | 13.9 /100 | #212 | Poor 27.2% |
| Okinawans | 13.7 /100 | #213 | Poor 27.2% |
| Africans | 13.0 /100 | #214 | Poor 27.2% |
| Northern Europeans | 12.8 /100 | #215 | Poor 27.2% |
| Cubans | 12.2 /100 | #216 | Poor 27.1% |
| U.S. Virgin Islanders | 12.1 /100 | #217 | Poor 27.1% |
| Greeks | 11.4 /100 | #218 | Poor 27.1% |
| Immigrants | Japan | 10.7 /100 | #219 | Poor 27.1% |
| Austrians | 9.9 /100 | #220 | Tragic 27.1% |
| New Zealanders | 9.6 /100 | #221 | Tragic 27.1% |
| Paraguayans | 9.4 /100 | #222 | Tragic 27.1% |
| Pima | 9.2 /100 | #223 | Tragic 27.1% |
| Germans | 8.7 /100 | #224 | Tragic 27.1% |
| Canadians | 7.5 /100 | #225 | Tragic 27.1% |
| Czechoslovakians | 6.6 /100 | #226 | Tragic 27.0% |
Demographics Similar to Uruguayans by Family Households with Children
In terms of family households with children, the demographic groups most similar to Uruguayans are Vietnamese (27.7%, a difference of 0.020%), Immigrants from Dominican Republic (27.7%, a difference of 0.030%), Immigrants from Portugal (27.7%, a difference of 0.040%), Spanish (27.7%, a difference of 0.050%), and Immigrants from Ecuador (27.7%, a difference of 0.060%).
| Demographics | Rating | Rank | Family Households with Children |
| Lebanese | 87.4 /100 | #131 | Excellent 27.7% |
| Immigrants | Belize | 85.7 /100 | #132 | Excellent 27.7% |
| Iranians | 85.2 /100 | #133 | Excellent 27.7% |
| Immigrants | Panama | 84.9 /100 | #134 | Excellent 27.7% |
| Immigrants | Ecuador | 84.6 /100 | #135 | Excellent 27.7% |
| Immigrants | Portugal | 84.1 /100 | #136 | Excellent 27.7% |
| Immigrants | Dominican Republic | 83.9 /100 | #137 | Excellent 27.7% |
| Uruguayans | 83.2 /100 | #138 | Excellent 27.7% |
| Vietnamese | 82.6 /100 | #139 | Excellent 27.7% |
| Spanish | 81.8 /100 | #140 | Excellent 27.7% |
| Immigrants | Eastern Asia | 81.7 /100 | #141 | Excellent 27.7% |
| Swiss | 81.4 /100 | #142 | Excellent 27.7% |
| Immigrants | Eastern Africa | 80.2 /100 | #143 | Excellent 27.7% |
| Brazilians | 79.6 /100 | #144 | Good 27.7% |
| Immigrants | Chile | 79.5 /100 | #145 | Good 27.7% |