Immigrants from Japan vs Immigrants from Southern Europe Family Households with Children
COMPARE
Immigrants from Japan
Immigrants from Southern Europe
Family Households with Children
Family Households with Children Comparison
Immigrants from Japan
Immigrants from Southern Europe
27.1%
FAMILY HOUSEHOLDS WITH CHILDREN
10.7/ 100
METRIC RATING
219th/ 347
METRIC RANK
26.9%
FAMILY HOUSEHOLDS WITH CHILDREN
3.4/ 100
METRIC RATING
239th/ 347
METRIC RANK
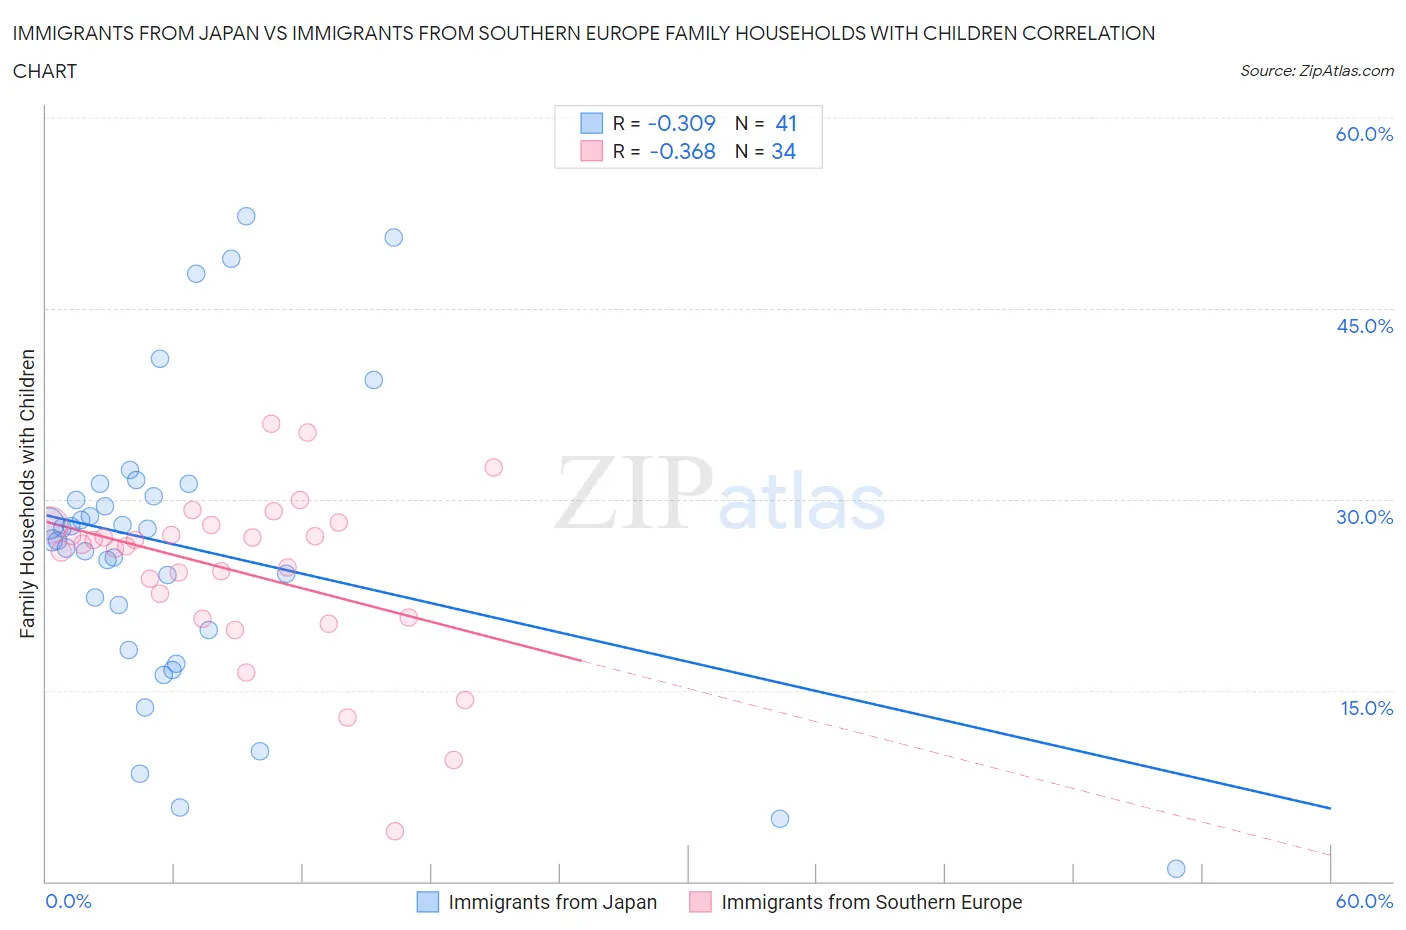
Immigrants from Japan vs Immigrants from Southern Europe Family Households with Children Correlation Chart
The statistical analysis conducted on geographies consisting of 339,902,345 people shows a mild negative correlation between the proportion of Immigrants from Japan and percentage of family households with children in the United States with a correlation coefficient (R) of -0.309 and weighted average of 27.1%. Similarly, the statistical analysis conducted on geographies consisting of 402,425,911 people shows a mild negative correlation between the proportion of Immigrants from Southern Europe and percentage of family households with children in the United States with a correlation coefficient (R) of -0.368 and weighted average of 26.9%, a difference of 0.69%.
Family Households with Children Correlation Summary
| Measurement | Immigrants from Japan | Immigrants from Southern Europe |
| Minimum | 1.0% | 3.9% |
| Maximum | 52.3% | 35.9% |
| Range | 51.3% | 32.0% |
| Mean | 26.2% | 24.3% |
| Median | 26.8% | 26.4% |
| Interquartile 25% (IQ1) | 19.0% | 20.7% |
| Interquartile 75% (IQ3) | 30.7% | 28.0% |
| Interquartile Range (IQR) | 11.7% | 7.3% |
| Standard Deviation (Sample) | 11.7% | 6.8% |
| Standard Deviation (Population) | 11.6% | 6.7% |
Demographics Similar to Immigrants from Japan and Immigrants from Southern Europe by Family Households with Children
In terms of family households with children, the demographic groups most similar to Immigrants from Japan are Austrian (27.1%, a difference of 0.050%), New Zealander (27.1%, a difference of 0.070%), Paraguayan (27.1%, a difference of 0.080%), Pima (27.1%, a difference of 0.090%), and German (27.1%, a difference of 0.13%). Similarly, the demographic groups most similar to Immigrants from Southern Europe are Moroccan (26.9%, a difference of 0.010%), Immigrants from Netherlands (26.9%, a difference of 0.020%), Cape Verdean (26.9%, a difference of 0.030%), Immigrants from Morocco (27.0%, a difference of 0.12%), and Immigrants from Germany (27.0%, a difference of 0.16%).
| Demographics | Rating | Rank | Family Households with Children |
| Immigrants | Japan | 10.7 /100 | #219 | Poor 27.1% |
| Austrians | 9.9 /100 | #220 | Tragic 27.1% |
| New Zealanders | 9.6 /100 | #221 | Tragic 27.1% |
| Paraguayans | 9.4 /100 | #222 | Tragic 27.1% |
| Pima | 9.2 /100 | #223 | Tragic 27.1% |
| Germans | 8.7 /100 | #224 | Tragic 27.1% |
| Canadians | 7.5 /100 | #225 | Tragic 27.1% |
| Czechoslovakians | 6.6 /100 | #226 | Tragic 27.0% |
| Tsimshian | 6.6 /100 | #227 | Tragic 27.0% |
| Scottish | 6.5 /100 | #228 | Tragic 27.0% |
| Immigrants | Caribbean | 6.3 /100 | #229 | Tragic 27.0% |
| Bulgarians | 5.8 /100 | #230 | Tragic 27.0% |
| Luxembourgers | 5.5 /100 | #231 | Tragic 27.0% |
| Yugoslavians | 5.1 /100 | #232 | Tragic 27.0% |
| Immigrants | Italy | 5.0 /100 | #233 | Tragic 27.0% |
| Immigrants | Germany | 4.4 /100 | #234 | Tragic 27.0% |
| Immigrants | Morocco | 4.2 /100 | #235 | Tragic 27.0% |
| Cape Verdeans | 3.6 /100 | #236 | Tragic 26.9% |
| Immigrants | Netherlands | 3.5 /100 | #237 | Tragic 26.9% |
| Moroccans | 3.4 /100 | #238 | Tragic 26.9% |
| Immigrants | Southern Europe | 3.4 /100 | #239 | Tragic 26.9% |