Immigrants from Japan vs Sudanese Family Households with Children
COMPARE
Immigrants from Japan
Sudanese
Family Households with Children
Family Households with Children Comparison
Immigrants from Japan
Sudanese
27.1%
FAMILY HOUSEHOLDS WITH CHILDREN
10.7/ 100
METRIC RATING
219th/ 347
METRIC RANK
27.4%
FAMILY HOUSEHOLDS WITH CHILDREN
37.6/ 100
METRIC RATING
191st/ 347
METRIC RANK
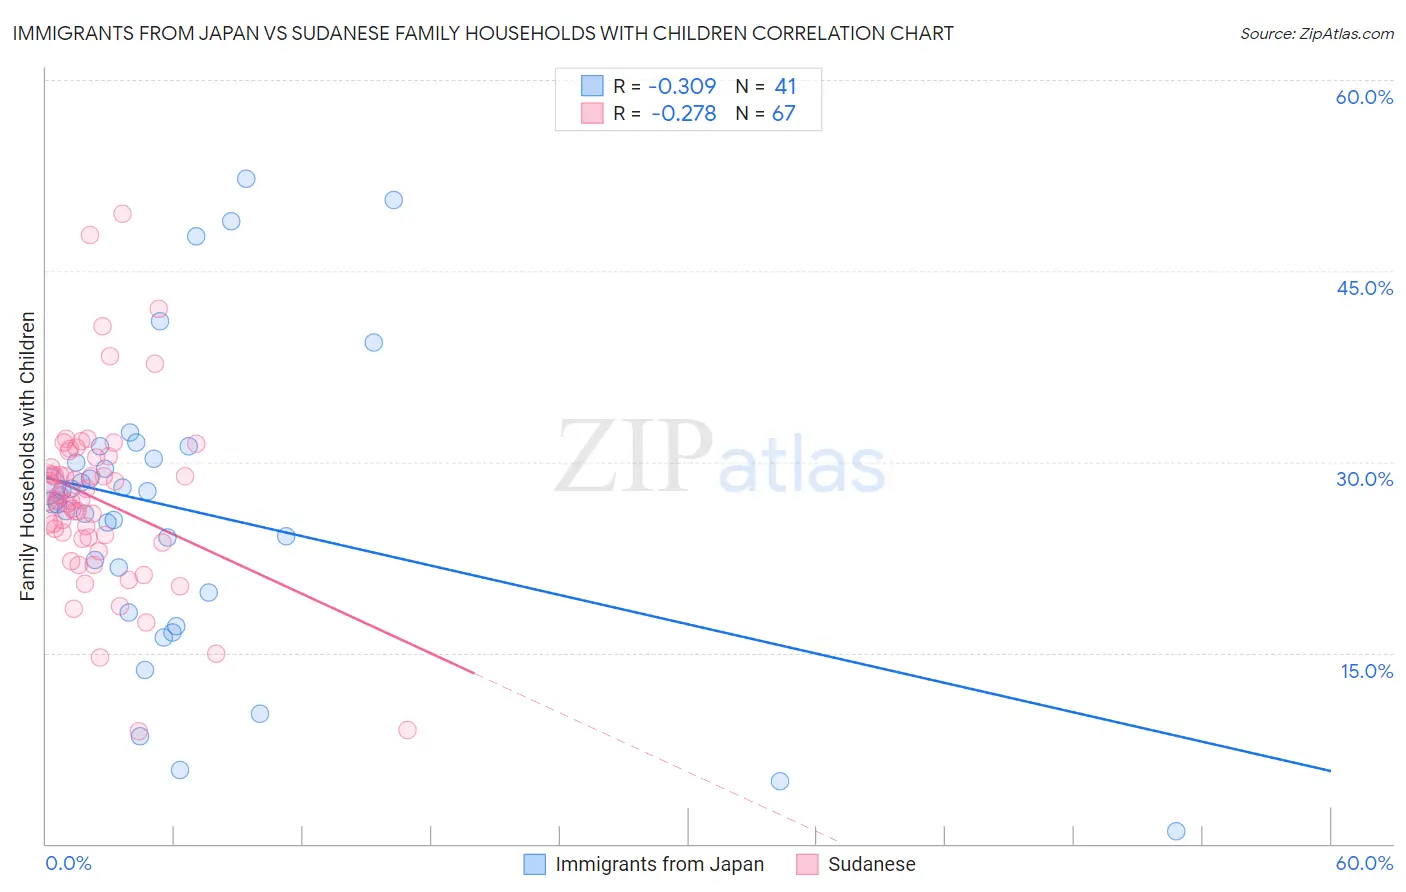
Immigrants from Japan vs Sudanese Family Households with Children Correlation Chart
The statistical analysis conducted on geographies consisting of 339,902,345 people shows a mild negative correlation between the proportion of Immigrants from Japan and percentage of family households with children in the United States with a correlation coefficient (R) of -0.309 and weighted average of 27.1%. Similarly, the statistical analysis conducted on geographies consisting of 110,102,819 people shows a weak negative correlation between the proportion of Sudanese and percentage of family households with children in the United States with a correlation coefficient (R) of -0.278 and weighted average of 27.4%, a difference of 0.90%.
Family Households with Children Correlation Summary
| Measurement | Immigrants from Japan | Sudanese |
| Minimum | 1.0% | 8.8% |
| Maximum | 52.3% | 49.5% |
| Range | 51.3% | 40.7% |
| Mean | 26.2% | 27.1% |
| Median | 26.8% | 27.0% |
| Interquartile 25% (IQ1) | 19.0% | 23.9% |
| Interquartile 75% (IQ3) | 30.7% | 30.4% |
| Interquartile Range (IQR) | 11.7% | 6.4% |
| Standard Deviation (Sample) | 11.7% | 7.1% |
| Standard Deviation (Population) | 11.6% | 7.1% |
Similar Demographics by Family Households with Children
Demographics Similar to Immigrants from Japan by Family Households with Children
In terms of family households with children, the demographic groups most similar to Immigrants from Japan are Greek (27.1%, a difference of 0.040%), Austrian (27.1%, a difference of 0.050%), New Zealander (27.1%, a difference of 0.070%), Cuban (27.1%, a difference of 0.080%), and U.S. Virgin Islander (27.1%, a difference of 0.080%).
| Demographics | Rating | Rank | Family Households with Children |
| Immigrants | Dominica | 13.9 /100 | #212 | Poor 27.2% |
| Okinawans | 13.7 /100 | #213 | Poor 27.2% |
| Africans | 13.0 /100 | #214 | Poor 27.2% |
| Northern Europeans | 12.8 /100 | #215 | Poor 27.2% |
| Cubans | 12.2 /100 | #216 | Poor 27.1% |
| U.S. Virgin Islanders | 12.1 /100 | #217 | Poor 27.1% |
| Greeks | 11.4 /100 | #218 | Poor 27.1% |
| Immigrants | Japan | 10.7 /100 | #219 | Poor 27.1% |
| Austrians | 9.9 /100 | #220 | Tragic 27.1% |
| New Zealanders | 9.6 /100 | #221 | Tragic 27.1% |
| Paraguayans | 9.4 /100 | #222 | Tragic 27.1% |
| Pima | 9.2 /100 | #223 | Tragic 27.1% |
| Germans | 8.7 /100 | #224 | Tragic 27.1% |
| Canadians | 7.5 /100 | #225 | Tragic 27.1% |
| Czechoslovakians | 6.6 /100 | #226 | Tragic 27.0% |
Demographics Similar to Sudanese by Family Households with Children
In terms of family households with children, the demographic groups most similar to Sudanese are Immigrants from Uruguay (27.4%, a difference of 0.0%), Pennsylvania German (27.4%, a difference of 0.0%), Immigrants from Israel (27.4%, a difference of 0.010%), Swedish (27.4%, a difference of 0.020%), and Dutch (27.4%, a difference of 0.030%).
| Demographics | Rating | Rank | Family Households with Children |
| Native Hawaiians | 44.6 /100 | #184 | Average 27.4% |
| Delaware | 42.0 /100 | #185 | Average 27.4% |
| Immigrants | Brazil | 40.6 /100 | #186 | Average 27.4% |
| Creek | 39.8 /100 | #187 | Fair 27.4% |
| Dutch | 38.8 /100 | #188 | Fair 27.4% |
| Immigrants | Israel | 37.9 /100 | #189 | Fair 27.4% |
| Immigrants | Uruguay | 37.7 /100 | #190 | Fair 27.4% |
| Sudanese | 37.6 /100 | #191 | Fair 27.4% |
| Pennsylvania Germans | 37.5 /100 | #192 | Fair 27.4% |
| Swedes | 36.9 /100 | #193 | Fair 27.4% |
| Immigrants | Iran | 36.1 /100 | #194 | Fair 27.4% |
| Crow | 35.7 /100 | #195 | Fair 27.4% |
| Cheyenne | 35.1 /100 | #196 | Fair 27.4% |
| Norwegians | 35.0 /100 | #197 | Fair 27.4% |
| Immigrants | Romania | 34.4 /100 | #198 | Fair 27.4% |