Immigrants from Japan vs Immigrants from Bulgaria Births to Unmarried Women
COMPARE
Immigrants from Japan
Immigrants from Bulgaria
Births to Unmarried Women
Births to Unmarried Women Comparison
Immigrants from Japan
Immigrants from Bulgaria
26.4%
BIRTHS TO UNMARRIED WOMEN
99.9/ 100
METRIC RATING
23rd/ 347
METRIC RANK
27.6%
BIRTHS TO UNMARRIED WOMEN
99.6/ 100
METRIC RATING
43rd/ 347
METRIC RANK
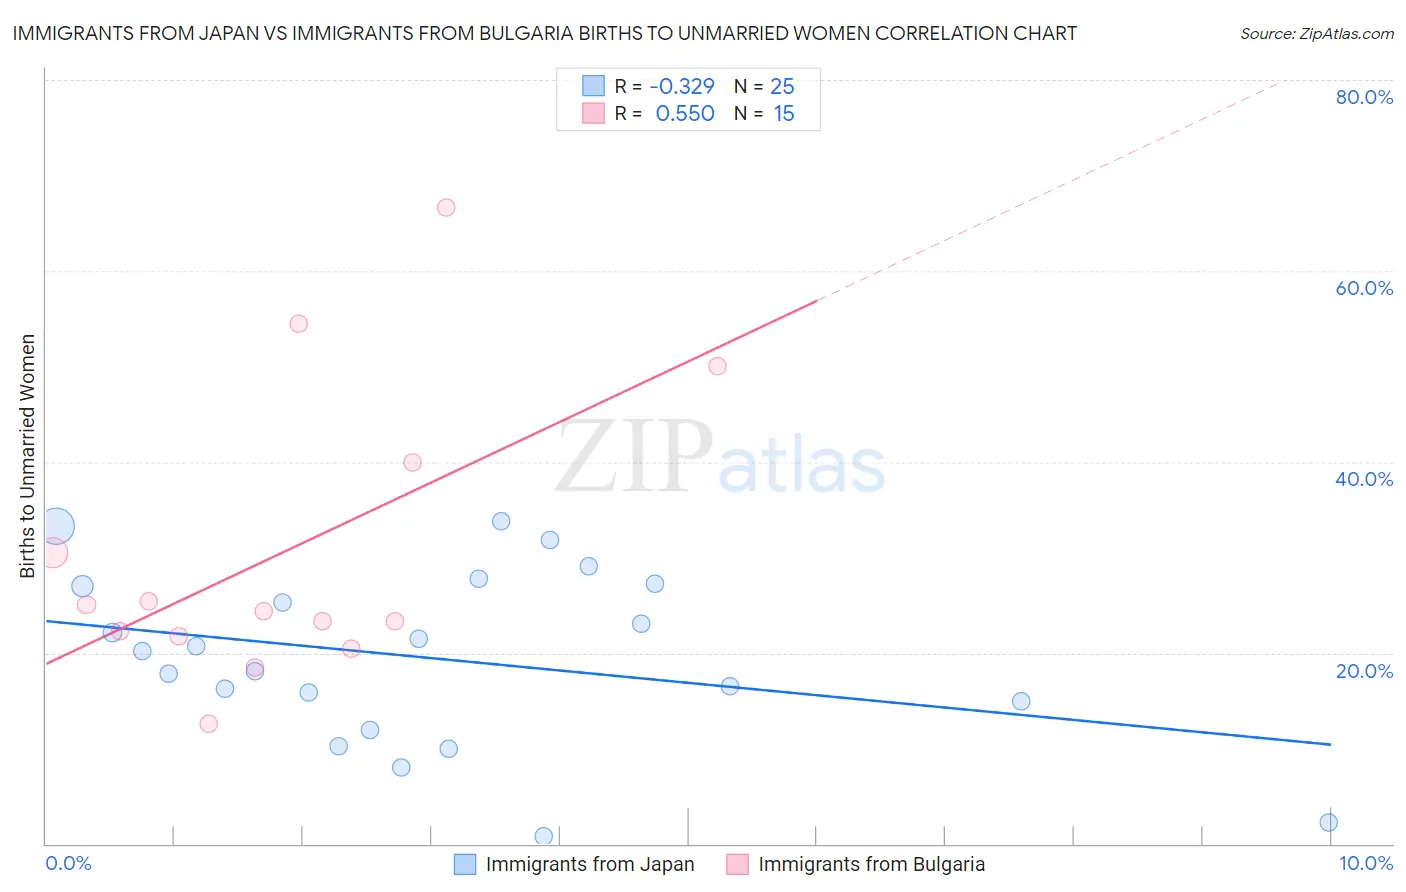
Immigrants from Japan vs Immigrants from Bulgaria Births to Unmarried Women Correlation Chart
The statistical analysis conducted on geographies consisting of 319,959,110 people shows a mild negative correlation between the proportion of Immigrants from Japan and percentage of births to unmarried women in the United States with a correlation coefficient (R) of -0.329 and weighted average of 26.4%. Similarly, the statistical analysis conducted on geographies consisting of 164,531,570 people shows a substantial positive correlation between the proportion of Immigrants from Bulgaria and percentage of births to unmarried women in the United States with a correlation coefficient (R) of 0.550 and weighted average of 27.6%, a difference of 4.6%.
Births to Unmarried Women Correlation Summary
| Measurement | Immigrants from Japan | Immigrants from Bulgaria |
| Minimum | 0.80% | 12.6% |
| Maximum | 33.8% | 66.7% |
| Range | 33.0% | 54.1% |
| Mean | 19.4% | 30.6% |
| Median | 20.2% | 24.4% |
| Interquartile 25% (IQ1) | 13.4% | 21.8% |
| Interquartile 75% (IQ3) | 27.1% | 40.0% |
| Interquartile Range (IQR) | 13.7% | 18.2% |
| Standard Deviation (Sample) | 9.0% | 15.3% |
| Standard Deviation (Population) | 8.8% | 14.8% |
Demographics Similar to Immigrants from Japan and Immigrants from Bulgaria by Births to Unmarried Women
In terms of births to unmarried women, the demographic groups most similar to Immigrants from Japan are Immigrants from Australia (26.6%, a difference of 0.79%), Cambodian (26.7%, a difference of 1.0%), Asian (26.8%, a difference of 1.4%), Immigrants from Asia (26.8%, a difference of 1.4%), and Okinawan (26.9%, a difference of 1.9%). Similarly, the demographic groups most similar to Immigrants from Bulgaria are Immigrants from Eastern Europe (27.6%, a difference of 0.23%), Iraqi (27.6%, a difference of 0.24%), Turkish (27.4%, a difference of 0.66%), Immigrants from Malaysia (27.4%, a difference of 0.98%), and Immigrants from Moldova (27.3%, a difference of 1.3%).
| Demographics | Rating | Rank | Births to Unmarried Women |
| Immigrants | Japan | 99.9 /100 | #23 | Exceptional 26.4% |
| Immigrants | Australia | 99.9 /100 | #24 | Exceptional 26.6% |
| Cambodians | 99.9 /100 | #25 | Exceptional 26.7% |
| Asians | 99.9 /100 | #26 | Exceptional 26.8% |
| Immigrants | Asia | 99.9 /100 | #27 | Exceptional 26.8% |
| Okinawans | 99.8 /100 | #28 | Exceptional 26.9% |
| Cypriots | 99.8 /100 | #29 | Exceptional 27.0% |
| Bulgarians | 99.8 /100 | #30 | Exceptional 27.1% |
| Immigrants | Iraq | 99.8 /100 | #31 | Exceptional 27.1% |
| Immigrants | Russia | 99.8 /100 | #32 | Exceptional 27.1% |
| Immigrants | Sri Lanka | 99.8 /100 | #33 | Exceptional 27.2% |
| Immigrants | Pakistan | 99.8 /100 | #34 | Exceptional 27.2% |
| Immigrants | Ireland | 99.7 /100 | #35 | Exceptional 27.2% |
| Immigrants | Western Asia | 99.7 /100 | #36 | Exceptional 27.2% |
| Immigrants | Ukraine | 99.7 /100 | #37 | Exceptional 27.2% |
| Immigrants | Moldova | 99.7 /100 | #38 | Exceptional 27.3% |
| Immigrants | Malaysia | 99.7 /100 | #39 | Exceptional 27.4% |
| Turks | 99.6 /100 | #40 | Exceptional 27.4% |
| Iraqis | 99.6 /100 | #41 | Exceptional 27.6% |
| Immigrants | Eastern Europe | 99.6 /100 | #42 | Exceptional 27.6% |
| Immigrants | Bulgaria | 99.6 /100 | #43 | Exceptional 27.6% |