Potawatomi vs Immigrants from Southern Europe Family Households with Children
COMPARE
Potawatomi
Immigrants from Southern Europe
Family Households with Children
Family Households with Children Comparison
Potawatomi
Immigrants from Southern Europe
26.9%
FAMILY HOUSEHOLDS WITH CHILDREN
2.2/ 100
METRIC RATING
247th/ 347
METRIC RANK
26.9%
FAMILY HOUSEHOLDS WITH CHILDREN
3.4/ 100
METRIC RATING
239th/ 347
METRIC RANK
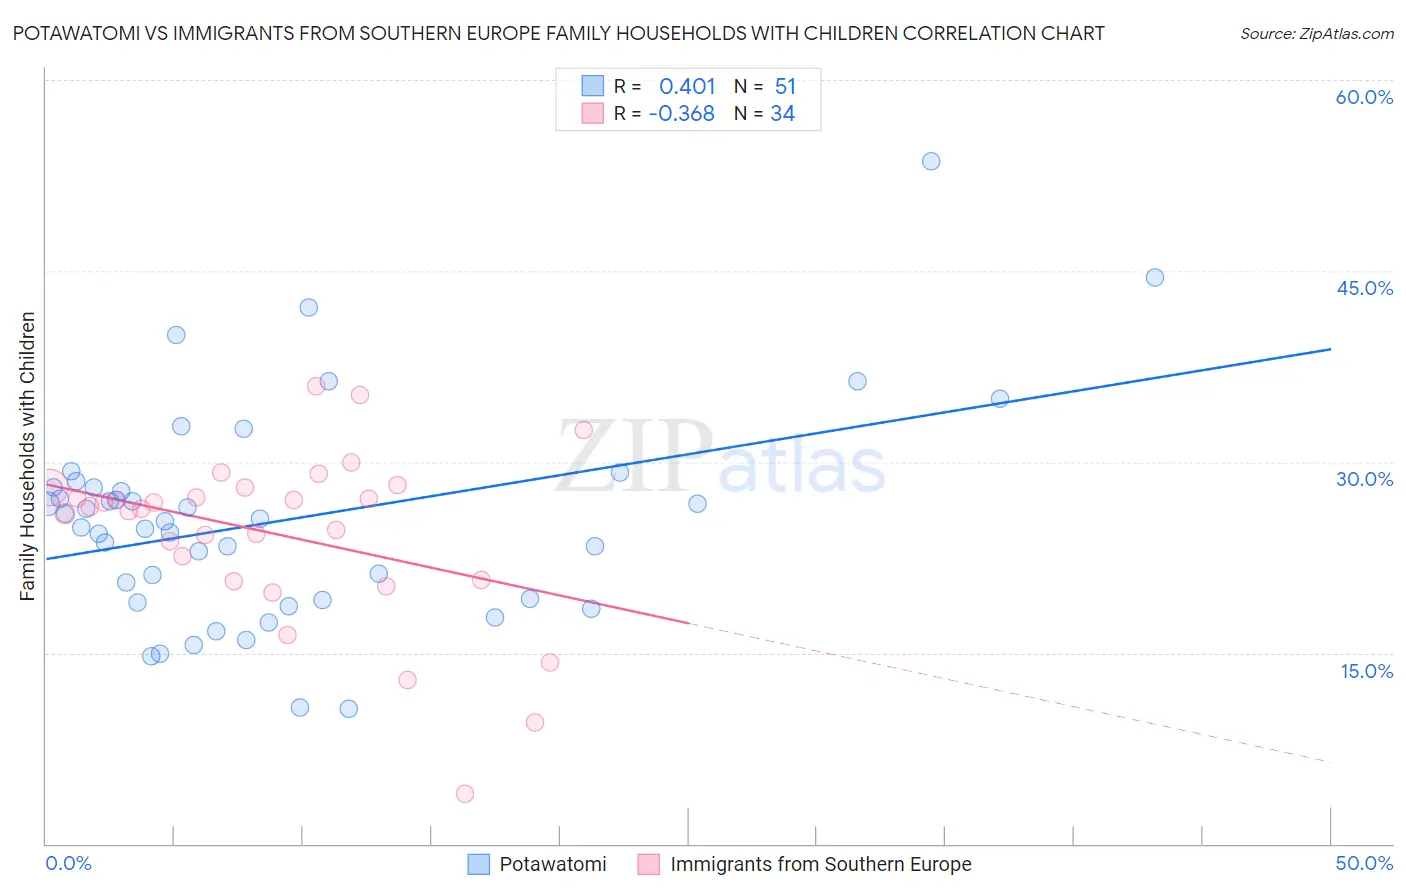
Potawatomi vs Immigrants from Southern Europe Family Households with Children Correlation Chart
The statistical analysis conducted on geographies consisting of 117,721,080 people shows a moderate positive correlation between the proportion of Potawatomi and percentage of family households with children in the United States with a correlation coefficient (R) of 0.401 and weighted average of 26.9%. Similarly, the statistical analysis conducted on geographies consisting of 402,425,911 people shows a mild negative correlation between the proportion of Immigrants from Southern Europe and percentage of family households with children in the United States with a correlation coefficient (R) of -0.368 and weighted average of 26.9%, a difference of 0.25%.
Family Households with Children Correlation Summary
| Measurement | Potawatomi | Immigrants from Southern Europe |
| Minimum | 10.6% | 3.9% |
| Maximum | 53.7% | 35.9% |
| Range | 43.0% | 32.0% |
| Mean | 25.5% | 24.3% |
| Median | 25.3% | 26.4% |
| Interquartile 25% (IQ1) | 19.2% | 20.7% |
| Interquartile 75% (IQ3) | 28.0% | 28.0% |
| Interquartile Range (IQR) | 8.8% | 7.3% |
| Standard Deviation (Sample) | 8.4% | 6.8% |
| Standard Deviation (Population) | 8.3% | 6.7% |
Demographics Similar to Potawatomi and Immigrants from Southern Europe by Family Households with Children
In terms of family households with children, the demographic groups most similar to Potawatomi are Immigrants from Kazakhstan (26.9%, a difference of 0.010%), Immigrants from Eastern Europe (26.9%, a difference of 0.030%), Belgian (26.9%, a difference of 0.030%), Jamaican (26.9%, a difference of 0.060%), and Immigrants from Bosnia and Herzegovina (26.8%, a difference of 0.090%). Similarly, the demographic groups most similar to Immigrants from Southern Europe are Moroccan (26.9%, a difference of 0.010%), Immigrants from Netherlands (26.9%, a difference of 0.020%), Immigrants from Bulgaria (26.9%, a difference of 0.020%), Navajo (26.9%, a difference of 0.020%), and Cape Verdean (26.9%, a difference of 0.030%).
| Demographics | Rating | Rank | Family Households with Children |
| Immigrants | Italy | 5.0 /100 | #233 | Tragic 27.0% |
| Immigrants | Germany | 4.4 /100 | #234 | Tragic 27.0% |
| Immigrants | Morocco | 4.2 /100 | #235 | Tragic 27.0% |
| Cape Verdeans | 3.6 /100 | #236 | Tragic 26.9% |
| Immigrants | Netherlands | 3.5 /100 | #237 | Tragic 26.9% |
| Moroccans | 3.4 /100 | #238 | Tragic 26.9% |
| Immigrants | Southern Europe | 3.4 /100 | #239 | Tragic 26.9% |
| Immigrants | Bulgaria | 3.3 /100 | #240 | Tragic 26.9% |
| Navajo | 3.2 /100 | #241 | Tragic 26.9% |
| Immigrants | England | 3.2 /100 | #242 | Tragic 26.9% |
| Immigrants | Saudi Arabia | 2.9 /100 | #243 | Tragic 26.9% |
| Ukrainians | 2.9 /100 | #244 | Tragic 26.9% |
| Australians | 2.8 /100 | #245 | Tragic 26.9% |
| Jamaicans | 2.5 /100 | #246 | Tragic 26.9% |
| Potawatomi | 2.2 /100 | #247 | Tragic 26.9% |
| Immigrants | Kazakhstan | 2.2 /100 | #248 | Tragic 26.9% |
| Immigrants | Eastern Europe | 2.1 /100 | #249 | Tragic 26.9% |
| Belgians | 2.1 /100 | #250 | Tragic 26.9% |
| Immigrants | Bosnia and Herzegovina | 1.9 /100 | #251 | Tragic 26.8% |
| Irish | 1.8 /100 | #252 | Tragic 26.8% |
| Italians | 1.5 /100 | #253 | Tragic 26.8% |