Immigrants from Japan vs Immigrants from Bulgaria Nursery School
COMPARE
Immigrants from Japan
Immigrants from Bulgaria
Nursery School
Nursery School Comparison
Immigrants from Japan
Immigrants from Bulgaria
98.2%
NURSERY SCHOOL
94.0/ 100
METRIC RATING
122nd/ 347
METRIC RANK
98.1%
NURSERY SCHOOL
89.4/ 100
METRIC RATING
134th/ 347
METRIC RANK
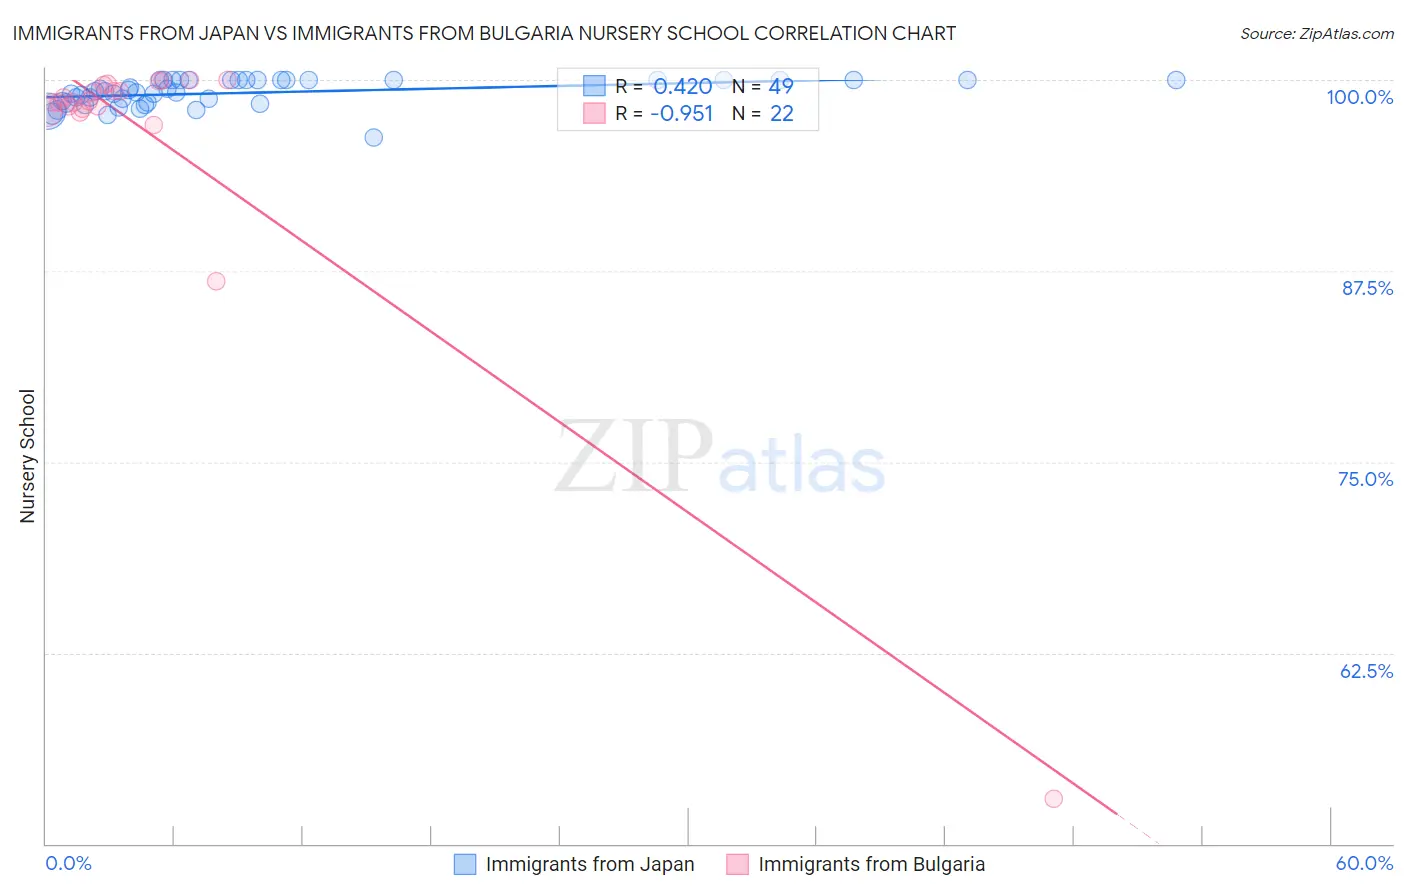
Immigrants from Japan vs Immigrants from Bulgaria Nursery School Correlation Chart
The statistical analysis conducted on geographies consisting of 340,149,128 people shows a moderate positive correlation between the proportion of Immigrants from Japan and percentage of population with at least nursery school education in the United States with a correlation coefficient (R) of 0.420 and weighted average of 98.2%. Similarly, the statistical analysis conducted on geographies consisting of 172,552,181 people shows a perfect negative correlation between the proportion of Immigrants from Bulgaria and percentage of population with at least nursery school education in the United States with a correlation coefficient (R) of -0.951 and weighted average of 98.1%, a difference of 0.050%.
Nursery School Correlation Summary
| Measurement | Immigrants from Japan | Immigrants from Bulgaria |
| Minimum | 96.2% | 52.9% |
| Maximum | 100.0% | 100.0% |
| Range | 3.8% | 47.1% |
| Mean | 99.2% | 96.2% |
| Median | 99.2% | 98.6% |
| Interquartile 25% (IQ1) | 98.5% | 98.2% |
| Interquartile 75% (IQ3) | 100.0% | 99.7% |
| Interquartile Range (IQR) | 1.5% | 1.5% |
| Standard Deviation (Sample) | 0.86% | 10.0% |
| Standard Deviation (Population) | 0.85% | 9.8% |
Demographics Similar to Immigrants from Japan and Immigrants from Bulgaria by Nursery School
In terms of nursery school, the demographic groups most similar to Immigrants from Japan are Immigrants from Zimbabwe (98.2%, a difference of 0.0%), Syrian (98.2%, a difference of 0.0%), Lebanese (98.2%, a difference of 0.0%), Iroquois (98.2%, a difference of 0.0%), and Okinawan (98.2%, a difference of 0.010%). Similarly, the demographic groups most similar to Immigrants from Bulgaria are Immigrants from Hungary (98.1%, a difference of 0.0%), Immigrants from Kuwait (98.1%, a difference of 0.0%), Spaniard (98.2%, a difference of 0.010%), Seminole (98.2%, a difference of 0.010%), and Immigrants from Europe (98.1%, a difference of 0.010%).
| Demographics | Rating | Rank | Nursery School |
| Yugoslavians | 95.4 /100 | #118 | Exceptional 98.2% |
| Thais | 95.0 /100 | #119 | Exceptional 98.2% |
| Okinawans | 94.5 /100 | #120 | Exceptional 98.2% |
| Immigrants | Zimbabwe | 94.2 /100 | #121 | Exceptional 98.2% |
| Immigrants | Japan | 94.0 /100 | #122 | Exceptional 98.2% |
| Syrians | 93.9 /100 | #123 | Exceptional 98.2% |
| Lebanese | 93.8 /100 | #124 | Exceptional 98.2% |
| Iroquois | 93.7 /100 | #125 | Exceptional 98.2% |
| Menominee | 93.6 /100 | #126 | Exceptional 98.2% |
| Immigrants | Saudi Arabia | 93.4 /100 | #127 | Exceptional 98.2% |
| Immigrants | Serbia | 92.4 /100 | #128 | Exceptional 98.2% |
| Cambodians | 91.4 /100 | #129 | Exceptional 98.2% |
| Immigrants | Croatia | 91.4 /100 | #130 | Exceptional 98.2% |
| Spaniards | 91.1 /100 | #131 | Exceptional 98.2% |
| Seminole | 90.9 /100 | #132 | Exceptional 98.2% |
| Immigrants | Europe | 90.7 /100 | #133 | Exceptional 98.1% |
| Immigrants | Bulgaria | 89.4 /100 | #134 | Excellent 98.1% |
| Immigrants | Hungary | 89.3 /100 | #135 | Excellent 98.1% |
| Immigrants | Kuwait | 88.9 /100 | #136 | Excellent 98.1% |
| Israelis | 88.2 /100 | #137 | Excellent 98.1% |
| Immigrants | Romania | 88.0 /100 | #138 | Excellent 98.1% |