Immigrants from Japan vs Immigrants from Bulgaria 11th Grade
COMPARE
Immigrants from Japan
Immigrants from Bulgaria
11th Grade
11th Grade Comparison
Immigrants from Japan
Immigrants from Bulgaria
93.8%
11TH GRADE
99.7/ 100
METRIC RATING
72nd/ 347
METRIC RANK
93.6%
11TH GRADE
99.1/ 100
METRIC RATING
92nd/ 347
METRIC RANK
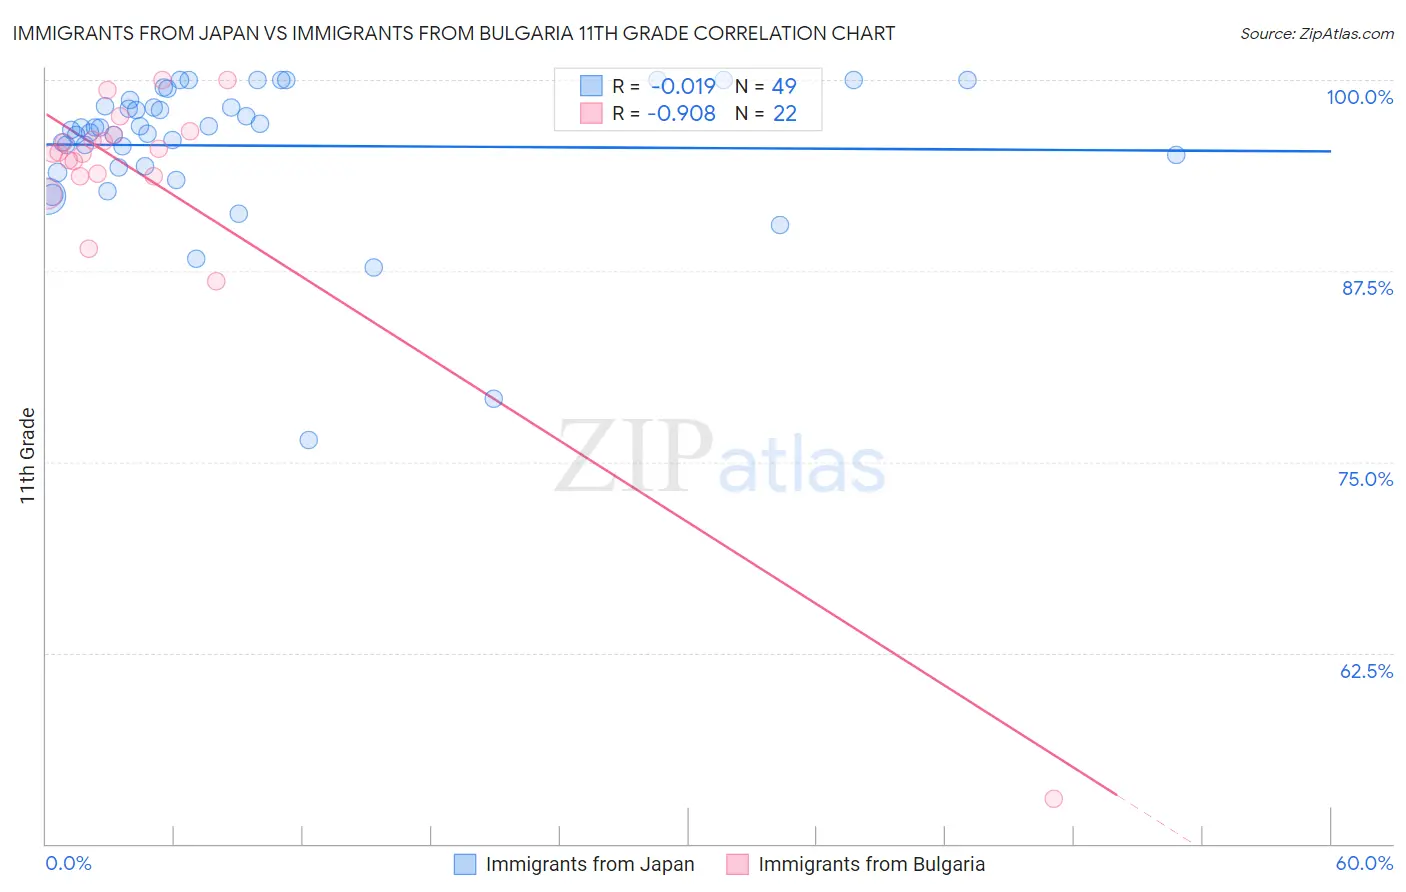
Immigrants from Japan vs Immigrants from Bulgaria 11th Grade Correlation Chart
The statistical analysis conducted on geographies consisting of 340,148,942 people shows no correlation between the proportion of Immigrants from Japan and percentage of population with at least 11th grade education in the United States with a correlation coefficient (R) of -0.019 and weighted average of 93.8%. Similarly, the statistical analysis conducted on geographies consisting of 172,552,181 people shows a near-perfect negative correlation between the proportion of Immigrants from Bulgaria and percentage of population with at least 11th grade education in the United States with a correlation coefficient (R) of -0.908 and weighted average of 93.6%, a difference of 0.22%.
11th Grade Correlation Summary
| Measurement | Immigrants from Japan | Immigrants from Bulgaria |
| Minimum | 76.5% | 52.9% |
| Maximum | 100.0% | 100.0% |
| Range | 23.5% | 47.1% |
| Mean | 95.7% | 93.2% |
| Median | 96.9% | 95.2% |
| Interquartile 25% (IQ1) | 94.3% | 93.7% |
| Interquartile 75% (IQ3) | 98.5% | 96.4% |
| Interquartile Range (IQR) | 4.2% | 2.7% |
| Standard Deviation (Sample) | 4.8% | 9.5% |
| Standard Deviation (Population) | 4.8% | 9.3% |
Demographics Similar to Immigrants from Japan and Immigrants from Bulgaria by 11th Grade
In terms of 11th grade, the demographic groups most similar to Immigrants from Japan are Romanian (93.8%, a difference of 0.020%), Immigrants from Czechoslovakia (93.8%, a difference of 0.020%), Immigrants from Latvia (93.8%, a difference of 0.040%), Celtic (93.7%, a difference of 0.060%), and Aleut (93.7%, a difference of 0.070%). Similarly, the demographic groups most similar to Immigrants from Bulgaria are South African (93.6%, a difference of 0.010%), Ottawa (93.6%, a difference of 0.020%), Immigrants from South Central Asia (93.6%, a difference of 0.030%), Immigrants from Western Europe (93.6%, a difference of 0.030%), and Cambodian (93.6%, a difference of 0.030%).
| Demographics | Rating | Rank | 11th Grade |
| Immigrants | Japan | 99.7 /100 | #72 | Exceptional 93.8% |
| Romanians | 99.6 /100 | #73 | Exceptional 93.8% |
| Immigrants | Czechoslovakia | 99.6 /100 | #74 | Exceptional 93.8% |
| Immigrants | Latvia | 99.6 /100 | #75 | Exceptional 93.8% |
| Celtics | 99.5 /100 | #76 | Exceptional 93.7% |
| Aleuts | 99.5 /100 | #77 | Exceptional 93.7% |
| Soviet Union | 99.5 /100 | #78 | Exceptional 93.7% |
| Immigrants | Denmark | 99.5 /100 | #79 | Exceptional 93.7% |
| Canadians | 99.5 /100 | #80 | Exceptional 93.7% |
| Immigrants | Moldova | 99.5 /100 | #81 | Exceptional 93.7% |
| Immigrants | Saudi Arabia | 99.3 /100 | #82 | Exceptional 93.7% |
| Icelanders | 99.3 /100 | #83 | Exceptional 93.6% |
| Immigrants | Taiwan | 99.3 /100 | #84 | Exceptional 93.6% |
| Immigrants | Switzerland | 99.3 /100 | #85 | Exceptional 93.6% |
| Immigrants | South Central Asia | 99.2 /100 | #86 | Exceptional 93.6% |
| Immigrants | Western Europe | 99.2 /100 | #87 | Exceptional 93.6% |
| Cambodians | 99.2 /100 | #88 | Exceptional 93.6% |
| Burmese | 99.2 /100 | #89 | Exceptional 93.6% |
| Ottawa | 99.2 /100 | #90 | Exceptional 93.6% |
| South Africans | 99.2 /100 | #91 | Exceptional 93.6% |
| Immigrants | Bulgaria | 99.1 /100 | #92 | Exceptional 93.6% |