Immigrants from Israel vs Mexican American Indian Single Mother Households
COMPARE
Immigrants from Israel
Mexican American Indian
Single Mother Households
Single Mother Households Comparison
Immigrants from Israel
Mexican American Indians
5.0%
SINGLE MOTHER HOUSEHOLDS
99.9/ 100
METRIC RATING
10th/ 347
METRIC RANK
7.4%
SINGLE MOTHER HOUSEHOLDS
0.2/ 100
METRIC RATING
255th/ 347
METRIC RANK
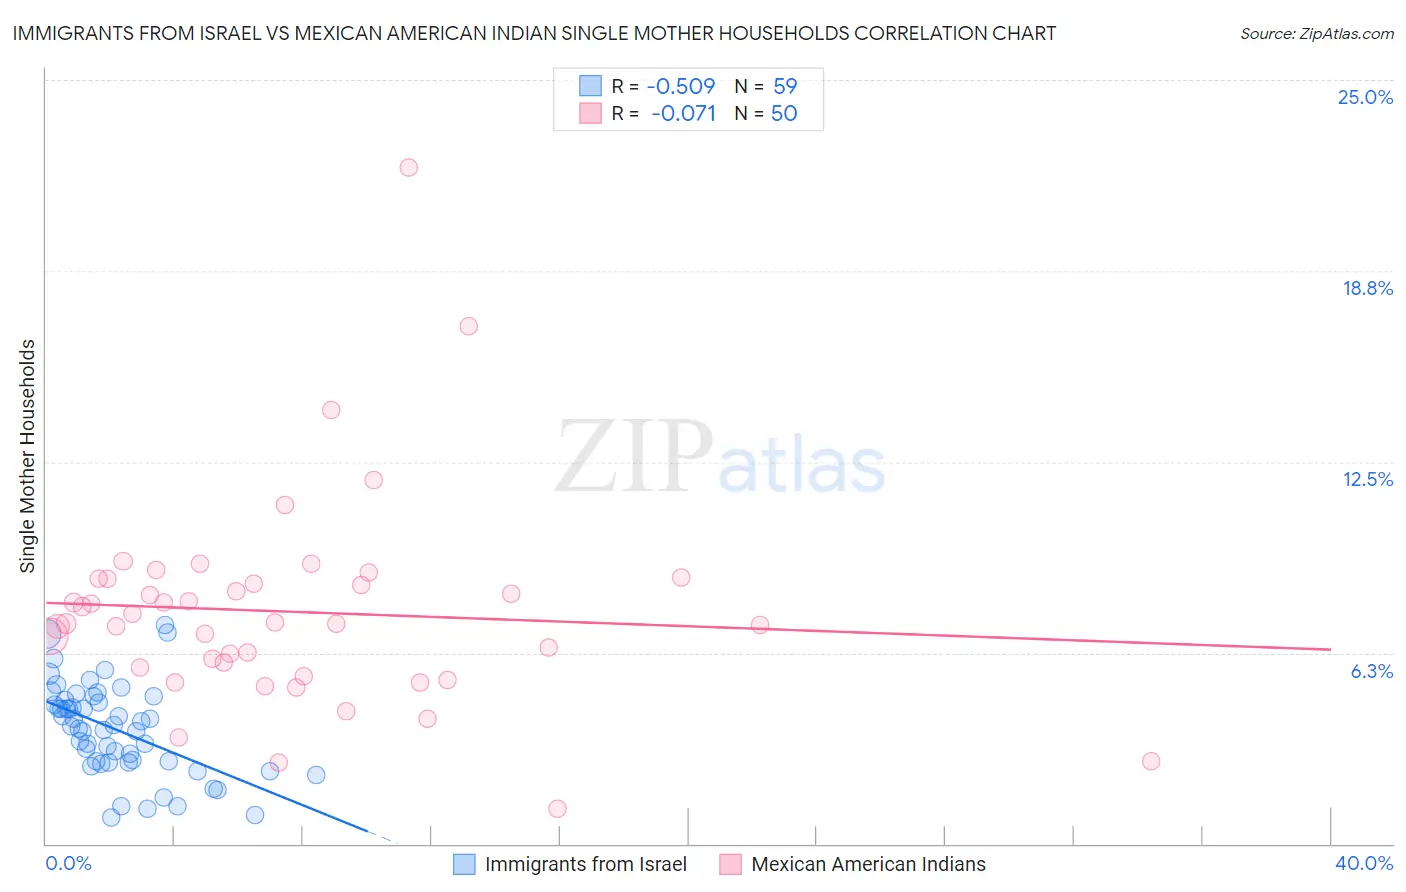
Immigrants from Israel vs Mexican American Indian Single Mother Households Correlation Chart
The statistical analysis conducted on geographies consisting of 209,589,874 people shows a substantial negative correlation between the proportion of Immigrants from Israel and percentage of single mother households in the United States with a correlation coefficient (R) of -0.509 and weighted average of 5.0%. Similarly, the statistical analysis conducted on geographies consisting of 317,232,303 people shows a slight negative correlation between the proportion of Mexican American Indians and percentage of single mother households in the United States with a correlation coefficient (R) of -0.071 and weighted average of 7.4%, a difference of 46.5%.
Single Mother Households Correlation Summary
| Measurement | Immigrants from Israel | Mexican American Indian |
| Minimum | 0.87% | 1.1% |
| Maximum | 7.1% | 22.1% |
| Range | 6.3% | 21.0% |
| Mean | 3.7% | 7.6% |
| Median | 3.9% | 7.2% |
| Interquartile 25% (IQ1) | 2.7% | 5.8% |
| Interquartile 75% (IQ3) | 4.7% | 8.7% |
| Interquartile Range (IQR) | 2.0% | 2.9% |
| Standard Deviation (Sample) | 1.5% | 3.4% |
| Standard Deviation (Population) | 1.5% | 3.4% |
Similar Demographics by Single Mother Households
Demographics Similar to Immigrants from Israel by Single Mother Households
In terms of single mother households, the demographic groups most similar to Immigrants from Israel are Okinawan (5.0%, a difference of 0.34%), Immigrants from Ireland (5.0%, a difference of 0.49%), Immigrants from China (5.1%, a difference of 0.63%), Cypriot (5.1%, a difference of 0.81%), and Immigrants from India (5.1%, a difference of 0.94%).
| Demographics | Rating | Rank | Single Mother Households |
| Immigrants | Iran | 100.0 /100 | #3 | Exceptional 4.8% |
| Assyrians/Chaldeans/Syriacs | 100.0 /100 | #4 | Exceptional 4.8% |
| Immigrants | Hong Kong | 100.0 /100 | #5 | Exceptional 4.8% |
| Immigrants | Singapore | 100.0 /100 | #6 | Exceptional 5.0% |
| Iranians | 100.0 /100 | #7 | Exceptional 5.0% |
| Immigrants | Ireland | 99.9 /100 | #8 | Exceptional 5.0% |
| Okinawans | 99.9 /100 | #9 | Exceptional 5.0% |
| Immigrants | Israel | 99.9 /100 | #10 | Exceptional 5.0% |
| Immigrants | China | 99.9 /100 | #11 | Exceptional 5.1% |
| Cypriots | 99.9 /100 | #12 | Exceptional 5.1% |
| Immigrants | India | 99.9 /100 | #13 | Exceptional 5.1% |
| Immigrants | Australia | 99.9 /100 | #14 | Exceptional 5.1% |
| Immigrants | Eastern Asia | 99.9 /100 | #15 | Exceptional 5.1% |
| Indians (Asian) | 99.9 /100 | #16 | Exceptional 5.1% |
| Soviet Union | 99.9 /100 | #17 | Exceptional 5.1% |
Demographics Similar to Mexican American Indians by Single Mother Households
In terms of single mother households, the demographic groups most similar to Mexican American Indians are Seminole (7.4%, a difference of 0.36%), Immigrants from Ecuador (7.3%, a difference of 0.37%), Alaska Native (7.4%, a difference of 0.40%), Cajun (7.3%, a difference of 0.42%), and Pueblo (7.4%, a difference of 0.42%).
| Demographics | Rating | Rank | Single Mother Households |
| Spanish American Indians | 0.4 /100 | #248 | Tragic 7.3% |
| Bermudans | 0.4 /100 | #249 | Tragic 7.3% |
| Immigrants | Africa | 0.4 /100 | #250 | Tragic 7.3% |
| Malaysians | 0.3 /100 | #251 | Tragic 7.3% |
| Alaskan Athabascans | 0.3 /100 | #252 | Tragic 7.3% |
| Cajuns | 0.3 /100 | #253 | Tragic 7.3% |
| Immigrants | Ecuador | 0.3 /100 | #254 | Tragic 7.3% |
| Mexican American Indians | 0.2 /100 | #255 | Tragic 7.4% |
| Seminole | 0.2 /100 | #256 | Tragic 7.4% |
| Alaska Natives | 0.2 /100 | #257 | Tragic 7.4% |
| Pueblo | 0.2 /100 | #258 | Tragic 7.4% |
| Immigrants | Yemen | 0.2 /100 | #259 | Tragic 7.4% |
| Immigrants | Zaire | 0.2 /100 | #260 | Tragic 7.4% |
| Japanese | 0.2 /100 | #261 | Tragic 7.4% |
| Immigrants | Somalia | 0.2 /100 | #262 | Tragic 7.4% |