Immigrants from Israel vs Immigrants Average Family Size
COMPARE
Immigrants from Israel
Immigrants
Average Family Size
Average Family Size Comparison
Immigrants from Israel
Immigrants
3.22
AVERAGE FAMILY SIZE
29.3/ 100
METRIC RATING
193rd/ 347
METRIC RANK
3.33
AVERAGE FAMILY SIZE
99.9/ 100
METRIC RATING
69th/ 347
METRIC RANK
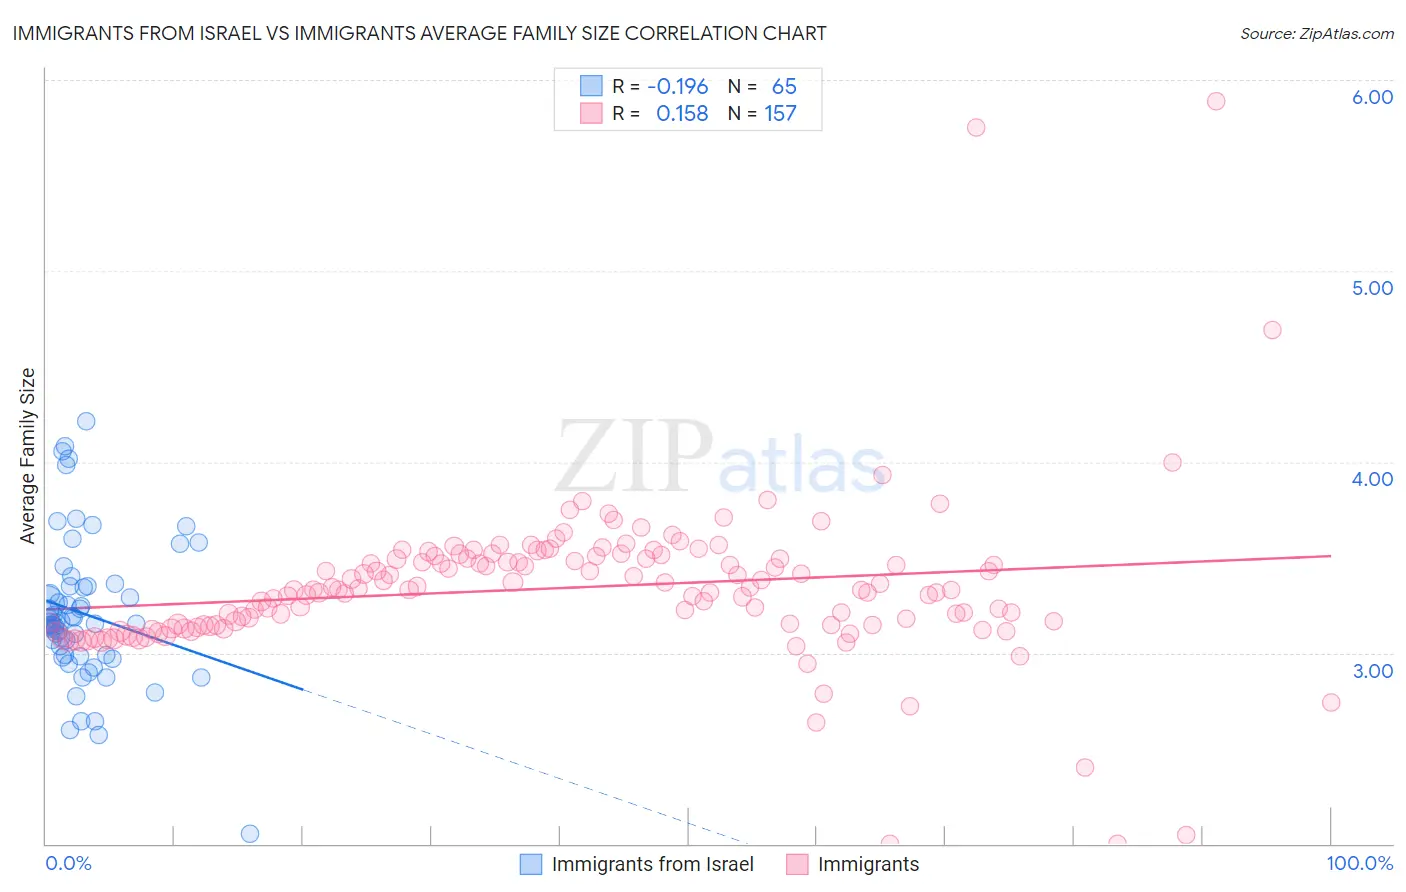
Immigrants from Israel vs Immigrants Average Family Size Correlation Chart
The statistical analysis conducted on geographies consisting of 209,937,123 people shows a poor negative correlation between the proportion of Immigrants from Israel and average family size in the United States with a correlation coefficient (R) of -0.196 and weighted average of 3.22. Similarly, the statistical analysis conducted on geographies consisting of 577,097,372 people shows a poor positive correlation between the proportion of Immigrants and average family size in the United States with a correlation coefficient (R) of 0.158 and weighted average of 3.33, a difference of 3.6%.
Average Family Size Correlation Summary
| Measurement | Immigrants from Israel | Immigrants |
| Minimum | 2.05 | 2.00 |
| Maximum | 4.21 | 5.89 |
| Range | 2.16 | 3.89 |
| Mean | 3.20 | 3.34 |
| Median | 3.16 | 3.33 |
| Interquartile 25% (IQ1) | 2.98 | 3.14 |
| Interquartile 75% (IQ3) | 3.35 | 3.49 |
| Interquartile Range (IQR) | 0.36 | 0.35 |
| Standard Deviation (Sample) | 0.38 | 0.42 |
| Standard Deviation (Population) | 0.38 | 0.42 |
Similar Demographics by Average Family Size
Demographics Similar to Immigrants from Israel by Average Family Size
In terms of average family size, the demographic groups most similar to Immigrants from Israel are Immigrants from Sudan (3.22, a difference of 0.0%), Immigrants from Eastern Africa (3.22, a difference of 0.020%), Choctaw (3.21, a difference of 0.020%), Senegalese (3.21, a difference of 0.020%), and Immigrants from Zaire (3.22, a difference of 0.030%).
| Demographics | Rating | Rank | Average Family Size |
| Immigrants | Argentina | 39.8 /100 | #186 | Fair 3.22 |
| Immigrants | Malaysia | 39.0 /100 | #187 | Fair 3.22 |
| Thais | 38.3 /100 | #188 | Fair 3.22 |
| Pakistanis | 33.7 /100 | #189 | Fair 3.22 |
| Burmese | 31.0 /100 | #190 | Fair 3.22 |
| Immigrants | Zaire | 30.5 /100 | #191 | Fair 3.22 |
| Immigrants | Eastern Africa | 30.1 /100 | #192 | Fair 3.22 |
| Immigrants | Israel | 29.3 /100 | #193 | Fair 3.22 |
| Immigrants | Sudan | 29.1 /100 | #194 | Fair 3.22 |
| Choctaw | 28.3 /100 | #195 | Fair 3.21 |
| Senegalese | 28.2 /100 | #196 | Fair 3.21 |
| Kenyans | 28.0 /100 | #197 | Fair 3.21 |
| Immigrants | Azores | 21.7 /100 | #198 | Fair 3.21 |
| Hmong | 20.7 /100 | #199 | Fair 3.21 |
| Immigrants | Kenya | 19.2 /100 | #200 | Poor 3.21 |
Demographics Similar to Immigrants by Average Family Size
In terms of average family size, the demographic groups most similar to Immigrants are Immigrants from Cambodia (3.33, a difference of 0.030%), Immigrants from Trinidad and Tobago (3.33, a difference of 0.050%), Immigrants from West Indies (3.33, a difference of 0.060%), Immigrants from Jamaica (3.33, a difference of 0.11%), and Immigrants from Caribbean (3.33, a difference of 0.13%).
| Demographics | Rating | Rank | Average Family Size |
| Immigrants | Grenada | 100.0 /100 | #62 | Exceptional 3.34 |
| Chinese | 100.0 /100 | #63 | Exceptional 3.34 |
| Dominicans | 99.9 /100 | #64 | Exceptional 3.34 |
| Immigrants | Laos | 99.9 /100 | #65 | Exceptional 3.34 |
| Immigrants | St. Vincent and the Grenadines | 99.9 /100 | #66 | Exceptional 3.34 |
| Immigrants | Jamaica | 99.9 /100 | #67 | Exceptional 3.33 |
| Immigrants | Cambodia | 99.9 /100 | #68 | Exceptional 3.33 |
| Immigrants | Immigrants | 99.9 /100 | #69 | Exceptional 3.33 |
| Immigrants | Trinidad and Tobago | 99.9 /100 | #70 | Exceptional 3.33 |
| Immigrants | West Indies | 99.9 /100 | #71 | Exceptional 3.33 |
| Immigrants | Caribbean | 99.9 /100 | #72 | Exceptional 3.33 |
| Yaqui | 99.9 /100 | #73 | Exceptional 3.32 |
| Immigrants | Sierra Leone | 99.9 /100 | #74 | Exceptional 3.32 |
| Immigrants | Barbados | 99.8 /100 | #75 | Exceptional 3.32 |
| Trinidadians and Tobagonians | 99.8 /100 | #76 | Exceptional 3.32 |