Immigrants from Israel vs Immigrants Family Households
COMPARE
Immigrants from Israel
Immigrants
Family Households
Family Households Comparison
Immigrants from Israel
Immigrants
63.4%
FAMILY HOUSEHOLDS
1.8/ 100
METRIC RATING
242nd/ 347
METRIC RANK
66.1%
FAMILY HOUSEHOLDS
100.0/ 100
METRIC RATING
55th/ 347
METRIC RANK
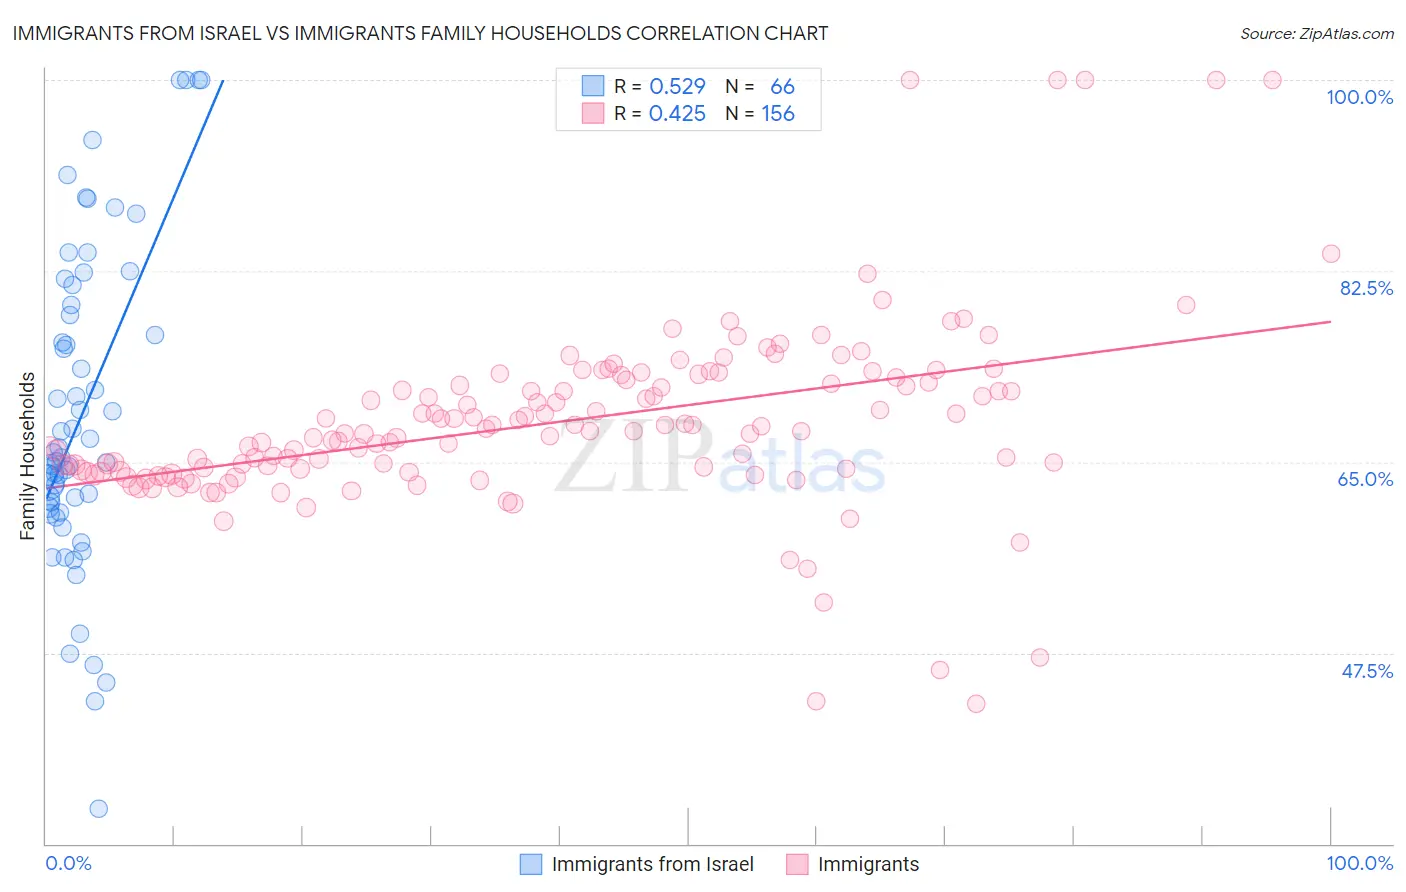
Immigrants from Israel vs Immigrants Family Households Correlation Chart
The statistical analysis conducted on geographies consisting of 209,979,754 people shows a substantial positive correlation between the proportion of Immigrants from Israel and percentage of family households in the United States with a correlation coefficient (R) of 0.529 and weighted average of 63.4%. Similarly, the statistical analysis conducted on geographies consisting of 577,097,366 people shows a moderate positive correlation between the proportion of Immigrants and percentage of family households in the United States with a correlation coefficient (R) of 0.425 and weighted average of 66.1%, a difference of 4.3%.
Family Households Correlation Summary
| Measurement | Immigrants from Israel | Immigrants |
| Minimum | 33.2% | 42.8% |
| Maximum | 100.0% | 100.0% |
| Range | 66.8% | 57.2% |
| Mean | 69.4% | 68.6% |
| Median | 65.6% | 67.8% |
| Interquartile 25% (IQ1) | 60.8% | 64.2% |
| Interquartile 75% (IQ3) | 79.4% | 72.4% |
| Interquartile Range (IQR) | 18.6% | 8.2% |
| Standard Deviation (Sample) | 14.6% | 8.6% |
| Standard Deviation (Population) | 14.5% | 8.5% |
Similar Demographics by Family Households
Demographics Similar to Immigrants from Israel by Family Households
In terms of family households, the demographic groups most similar to Immigrants from Israel are Aleut (63.4%, a difference of 0.010%), South African (63.4%, a difference of 0.010%), Immigrants from St. Vincent and the Grenadines (63.4%, a difference of 0.010%), Immigrants from Czechoslovakia (63.4%, a difference of 0.010%), and Immigrants from Zimbabwe (63.5%, a difference of 0.040%).
| Demographics | Rating | Rank | Family Households |
| Albanians | 2.2 /100 | #235 | Tragic 63.5% |
| Ghanaians | 2.1 /100 | #236 | Tragic 63.5% |
| Comanche | 2.1 /100 | #237 | Tragic 63.5% |
| Immigrants | Zimbabwe | 2.0 /100 | #238 | Tragic 63.5% |
| Aleuts | 1.9 /100 | #239 | Tragic 63.4% |
| South Africans | 1.9 /100 | #240 | Tragic 63.4% |
| Immigrants | St. Vincent and the Grenadines | 1.9 /100 | #241 | Tragic 63.4% |
| Immigrants | Israel | 1.8 /100 | #242 | Tragic 63.4% |
| Immigrants | Czechoslovakia | 1.8 /100 | #243 | Tragic 63.4% |
| Eastern Europeans | 1.6 /100 | #244 | Tragic 63.4% |
| Immigrants | Dominica | 1.6 /100 | #245 | Tragic 63.4% |
| Immigrants | Ghana | 1.6 /100 | #246 | Tragic 63.4% |
| Immigrants | Uzbekistan | 1.5 /100 | #247 | Tragic 63.4% |
| Dominicans | 1.5 /100 | #248 | Tragic 63.4% |
| Russians | 1.4 /100 | #249 | Tragic 63.4% |
Demographics Similar to Immigrants by Family Households
In terms of family households, the demographic groups most similar to Immigrants are Immigrants from Hong Kong (66.1%, a difference of 0.010%), Pennsylvania German (66.1%, a difference of 0.030%), Immigrants from Asia (66.1%, a difference of 0.14%), Immigrants from Korea (66.0%, a difference of 0.15%), and South American (66.0%, a difference of 0.16%).
| Demographics | Rating | Rank | Family Households |
| Immigrants | Venezuela | 100.0 /100 | #48 | Exceptional 66.4% |
| Immigrants | South Central Asia | 100.0 /100 | #49 | Exceptional 66.4% |
| Navajo | 100.0 /100 | #50 | Exceptional 66.4% |
| Natives/Alaskans | 100.0 /100 | #51 | Exceptional 66.4% |
| Colombians | 100.0 /100 | #52 | Exceptional 66.3% |
| Afghans | 100.0 /100 | #53 | Exceptional 66.3% |
| Immigrants | Colombia | 100.0 /100 | #54 | Exceptional 66.3% |
| Immigrants | Immigrants | 100.0 /100 | #55 | Exceptional 66.1% |
| Immigrants | Hong Kong | 100.0 /100 | #56 | Exceptional 66.1% |
| Pennsylvania Germans | 100.0 /100 | #57 | Exceptional 66.1% |
| Immigrants | Asia | 100.0 /100 | #58 | Exceptional 66.1% |
| Immigrants | Korea | 100.0 /100 | #59 | Exceptional 66.0% |
| South Americans | 100.0 /100 | #60 | Exceptional 66.0% |
| Danes | 100.0 /100 | #61 | Exceptional 66.0% |
| Central Americans | 100.0 /100 | #62 | Exceptional 66.0% |