Crow vs Immigrants Average Family Size
COMPARE
Crow
Immigrants
Average Family Size
Average Family Size Comparison
Crow
Immigrants
3.82
AVERAGE FAMILY SIZE
100/ 100
METRIC RATING
2nd/ 347
METRIC RANK
3.33
AVERAGE FAMILY SIZE
99.9/ 100
METRIC RATING
69th/ 347
METRIC RANK
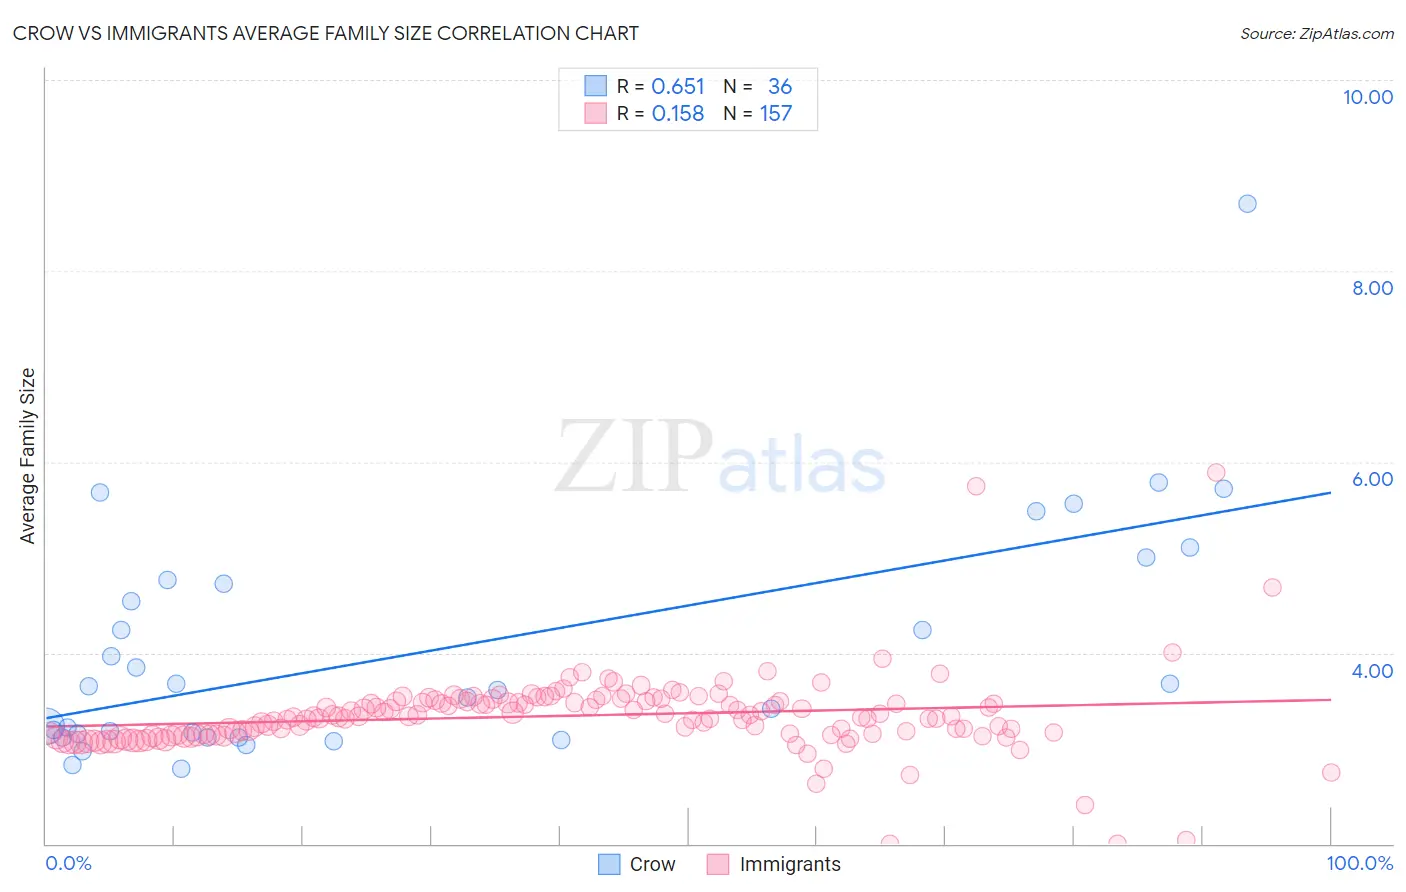
Crow vs Immigrants Average Family Size Correlation Chart
The statistical analysis conducted on geographies consisting of 59,202,817 people shows a significant positive correlation between the proportion of Crow and average family size in the United States with a correlation coefficient (R) of 0.651 and weighted average of 3.82. Similarly, the statistical analysis conducted on geographies consisting of 577,097,372 people shows a poor positive correlation between the proportion of Immigrants and average family size in the United States with a correlation coefficient (R) of 0.158 and weighted average of 3.33, a difference of 14.8%.
Average Family Size Correlation Summary
| Measurement | Crow | Immigrants |
| Minimum | 2.78 | 2.00 |
| Maximum | 8.70 | 5.89 |
| Range | 5.92 | 3.89 |
| Mean | 4.03 | 3.34 |
| Median | 3.63 | 3.33 |
| Interquartile 25% (IQ1) | 3.13 | 3.14 |
| Interquartile 75% (IQ3) | 4.74 | 3.49 |
| Interquartile Range (IQR) | 1.61 | 0.35 |
| Standard Deviation (Sample) | 1.23 | 0.42 |
| Standard Deviation (Population) | 1.22 | 0.42 |
Similar Demographics by Average Family Size
Demographics Similar to Crow by Average Family Size
In terms of average family size, the demographic groups most similar to Crow are Pueblo (3.79, a difference of 0.81%), Pima (3.75, a difference of 2.1%), Yup'ik (4.00, a difference of 4.5%), Navajo (3.65, a difference of 4.9%), and Arapaho (3.64, a difference of 5.2%).
| Demographics | Rating | Rank | Average Family Size |
| Yup'ik | 100 /100 | #1 | Exceptional 4.00 |
| Crow | 100 /100 | #2 | Exceptional 3.82 |
| Pueblo | 100 /100 | #3 | Exceptional 3.79 |
| Pima | 100 /100 | #4 | Exceptional 3.75 |
| Navajo | 100.0 /100 | #5 | Exceptional 3.65 |
| Arapaho | 100.0 /100 | #6 | Exceptional 3.64 |
| Inupiat | 100.0 /100 | #7 | Exceptional 3.63 |
| Immigrants | Yemen | 100.0 /100 | #8 | Exceptional 3.60 |
| Hopi | 100.0 /100 | #9 | Exceptional 3.60 |
| Spanish American Indians | 100.0 /100 | #10 | Exceptional 3.58 |
| Tohono O'odham | 100.0 /100 | #11 | Exceptional 3.53 |
| Immigrants | Mexico | 100.0 /100 | #12 | Exceptional 3.52 |
| Sioux | 100.0 /100 | #13 | Exceptional 3.52 |
| Immigrants | Central America | 100.0 /100 | #14 | Exceptional 3.49 |
| Tongans | 100.0 /100 | #15 | Exceptional 3.49 |
Demographics Similar to Immigrants by Average Family Size
In terms of average family size, the demographic groups most similar to Immigrants are Immigrants from Cambodia (3.33, a difference of 0.030%), Immigrants from Trinidad and Tobago (3.33, a difference of 0.050%), Immigrants from West Indies (3.33, a difference of 0.060%), Immigrants from Jamaica (3.33, a difference of 0.11%), and Immigrants from Caribbean (3.33, a difference of 0.13%).
| Demographics | Rating | Rank | Average Family Size |
| Immigrants | Grenada | 100.0 /100 | #62 | Exceptional 3.34 |
| Chinese | 100.0 /100 | #63 | Exceptional 3.34 |
| Dominicans | 99.9 /100 | #64 | Exceptional 3.34 |
| Immigrants | Laos | 99.9 /100 | #65 | Exceptional 3.34 |
| Immigrants | St. Vincent and the Grenadines | 99.9 /100 | #66 | Exceptional 3.34 |
| Immigrants | Jamaica | 99.9 /100 | #67 | Exceptional 3.33 |
| Immigrants | Cambodia | 99.9 /100 | #68 | Exceptional 3.33 |
| Immigrants | Immigrants | 99.9 /100 | #69 | Exceptional 3.33 |
| Immigrants | Trinidad and Tobago | 99.9 /100 | #70 | Exceptional 3.33 |
| Immigrants | West Indies | 99.9 /100 | #71 | Exceptional 3.33 |
| Immigrants | Caribbean | 99.9 /100 | #72 | Exceptional 3.33 |
| Yaqui | 99.9 /100 | #73 | Exceptional 3.32 |
| Immigrants | Sierra Leone | 99.9 /100 | #74 | Exceptional 3.32 |
| Immigrants | Barbados | 99.8 /100 | #75 | Exceptional 3.32 |
| Trinidadians and Tobagonians | 99.8 /100 | #76 | Exceptional 3.32 |