Immigrants from Israel vs Ute Average Family Size
COMPARE
Immigrants from Israel
Ute
Average Family Size
Average Family Size Comparison
Immigrants from Israel
Ute
3.22
AVERAGE FAMILY SIZE
29.3/ 100
METRIC RATING
193rd/ 347
METRIC RANK
3.49
AVERAGE FAMILY SIZE
100.0/ 100
METRIC RATING
16th/ 347
METRIC RANK
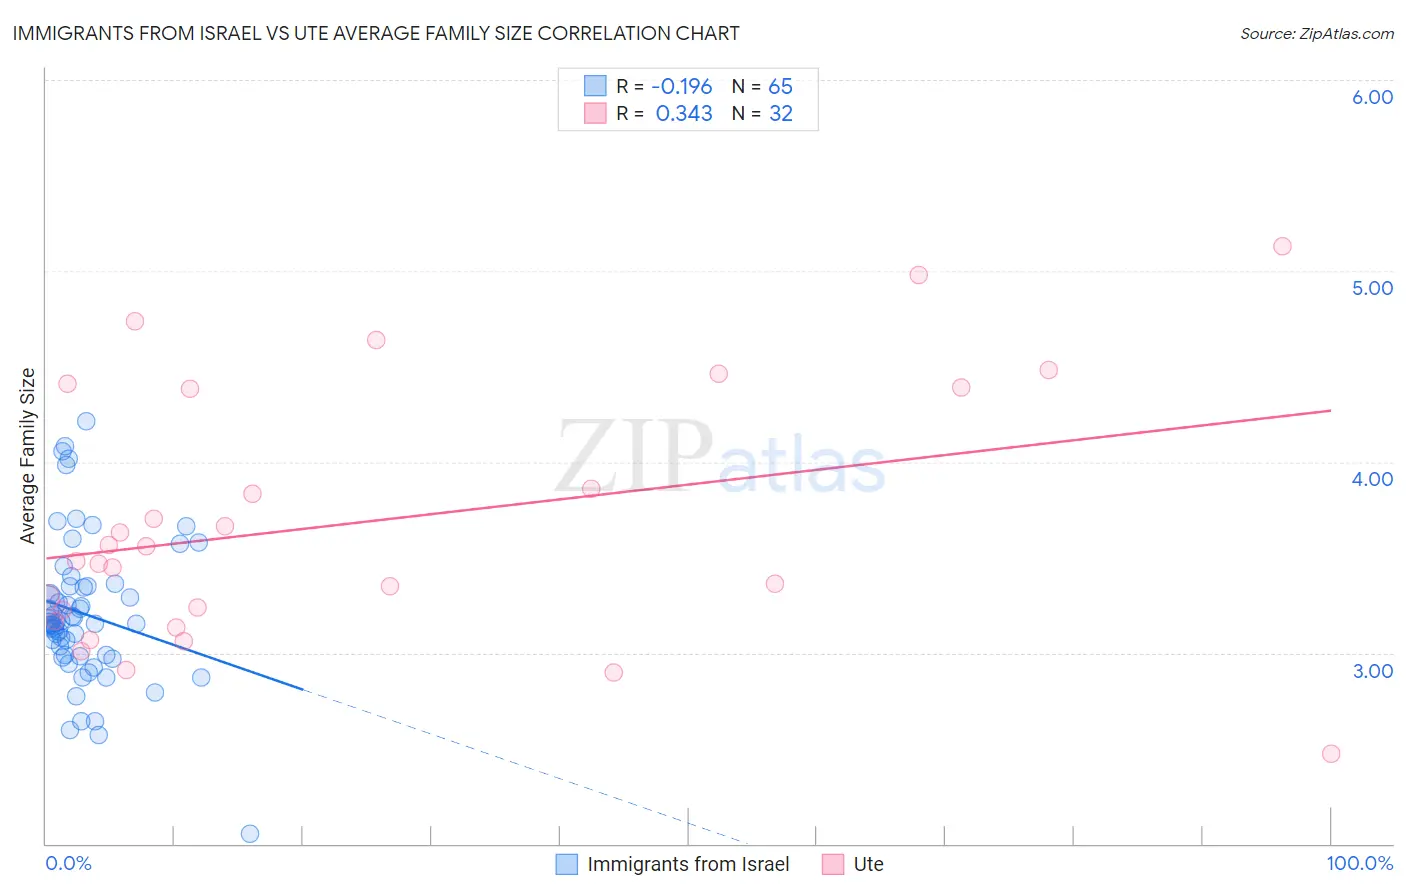
Immigrants from Israel vs Ute Average Family Size Correlation Chart
The statistical analysis conducted on geographies consisting of 209,937,123 people shows a poor negative correlation between the proportion of Immigrants from Israel and average family size in the United States with a correlation coefficient (R) of -0.196 and weighted average of 3.22. Similarly, the statistical analysis conducted on geographies consisting of 55,658,636 people shows a mild positive correlation between the proportion of Ute and average family size in the United States with a correlation coefficient (R) of 0.343 and weighted average of 3.49, a difference of 8.5%.
Average Family Size Correlation Summary
| Measurement | Immigrants from Israel | Ute |
| Minimum | 2.05 | 2.47 |
| Maximum | 4.21 | 5.13 |
| Range | 2.16 | 2.66 |
| Mean | 3.20 | 3.69 |
| Median | 3.16 | 3.52 |
| Interquartile 25% (IQ1) | 2.98 | 3.19 |
| Interquartile 75% (IQ3) | 3.35 | 4.38 |
| Interquartile Range (IQR) | 0.36 | 1.19 |
| Standard Deviation (Sample) | 0.38 | 0.67 |
| Standard Deviation (Population) | 0.38 | 0.66 |
Similar Demographics by Average Family Size
Demographics Similar to Immigrants from Israel by Average Family Size
In terms of average family size, the demographic groups most similar to Immigrants from Israel are Immigrants from Sudan (3.22, a difference of 0.0%), Immigrants from Eastern Africa (3.22, a difference of 0.020%), Choctaw (3.21, a difference of 0.020%), Senegalese (3.21, a difference of 0.020%), and Immigrants from Zaire (3.22, a difference of 0.030%).
| Demographics | Rating | Rank | Average Family Size |
| Immigrants | Argentina | 39.8 /100 | #186 | Fair 3.22 |
| Immigrants | Malaysia | 39.0 /100 | #187 | Fair 3.22 |
| Thais | 38.3 /100 | #188 | Fair 3.22 |
| Pakistanis | 33.7 /100 | #189 | Fair 3.22 |
| Burmese | 31.0 /100 | #190 | Fair 3.22 |
| Immigrants | Zaire | 30.5 /100 | #191 | Fair 3.22 |
| Immigrants | Eastern Africa | 30.1 /100 | #192 | Fair 3.22 |
| Immigrants | Israel | 29.3 /100 | #193 | Fair 3.22 |
| Immigrants | Sudan | 29.1 /100 | #194 | Fair 3.22 |
| Choctaw | 28.3 /100 | #195 | Fair 3.21 |
| Senegalese | 28.2 /100 | #196 | Fair 3.21 |
| Kenyans | 28.0 /100 | #197 | Fair 3.21 |
| Immigrants | Azores | 21.7 /100 | #198 | Fair 3.21 |
| Hmong | 20.7 /100 | #199 | Fair 3.21 |
| Immigrants | Kenya | 19.2 /100 | #200 | Poor 3.21 |
Demographics Similar to Ute by Average Family Size
In terms of average family size, the demographic groups most similar to Ute are Tongan (3.49, a difference of 0.060%), Immigrants from El Salvador (3.49, a difference of 0.090%), Immigrants from Central America (3.49, a difference of 0.11%), Salvadoran (3.48, a difference of 0.34%), and Mexican (3.48, a difference of 0.40%).
| Demographics | Rating | Rank | Average Family Size |
| Hopi | 100.0 /100 | #9 | Exceptional 3.60 |
| Spanish American Indians | 100.0 /100 | #10 | Exceptional 3.58 |
| Tohono O'odham | 100.0 /100 | #11 | Exceptional 3.53 |
| Immigrants | Mexico | 100.0 /100 | #12 | Exceptional 3.52 |
| Sioux | 100.0 /100 | #13 | Exceptional 3.52 |
| Immigrants | Central America | 100.0 /100 | #14 | Exceptional 3.49 |
| Tongans | 100.0 /100 | #15 | Exceptional 3.49 |
| Ute | 100.0 /100 | #16 | Exceptional 3.49 |
| Immigrants | El Salvador | 100.0 /100 | #17 | Exceptional 3.49 |
| Salvadorans | 100.0 /100 | #18 | Exceptional 3.48 |
| Mexicans | 100.0 /100 | #19 | Exceptional 3.48 |
| Cheyenne | 100.0 /100 | #20 | Exceptional 3.47 |
| Yuman | 100.0 /100 | #21 | Exceptional 3.47 |
| Apache | 100.0 /100 | #22 | Exceptional 3.46 |
| Immigrants | Fiji | 100.0 /100 | #23 | Exceptional 3.45 |