Immigrants from Iraq vs Panamanian Married-couple Households
COMPARE
Immigrants from Iraq
Panamanian
Married-couple Households
Married-couple Households Comparison
Immigrants from Iraq
Panamanians
47.3%
MARRIED-COUPLE HOUSEHOLDS
87.8/ 100
METRIC RATING
129th/ 347
METRIC RANK
45.2%
MARRIED-COUPLE HOUSEHOLDS
5.5/ 100
METRIC RATING
217th/ 347
METRIC RANK
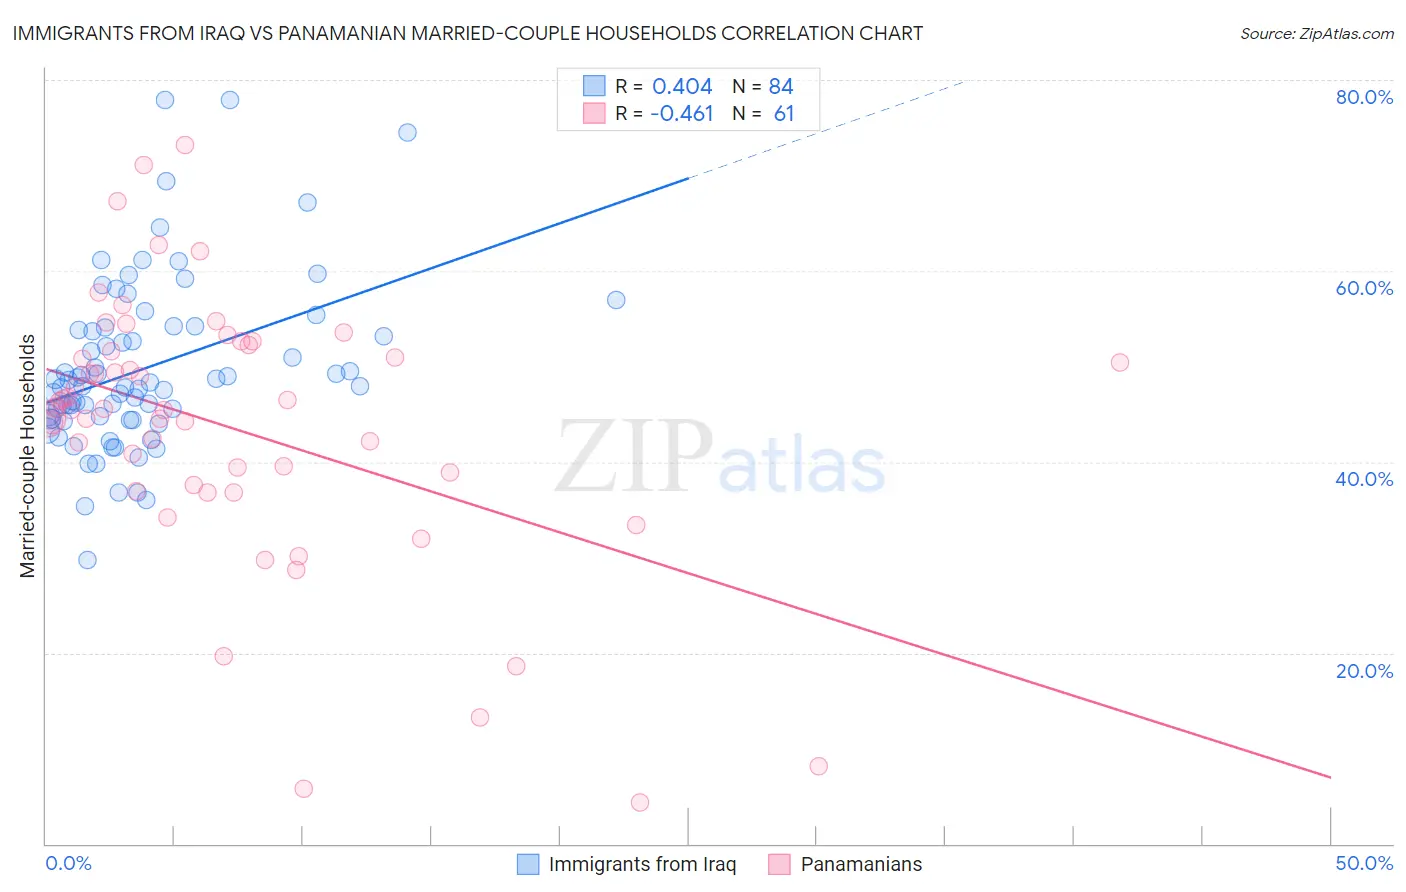
Immigrants from Iraq vs Panamanian Married-couple Households Correlation Chart
The statistical analysis conducted on geographies consisting of 194,749,304 people shows a moderate positive correlation between the proportion of Immigrants from Iraq and percentage of married-couple family households in the United States with a correlation coefficient (R) of 0.404 and weighted average of 47.3%. Similarly, the statistical analysis conducted on geographies consisting of 281,067,413 people shows a moderate negative correlation between the proportion of Panamanians and percentage of married-couple family households in the United States with a correlation coefficient (R) of -0.461 and weighted average of 45.2%, a difference of 4.7%.
Married-couple Households Correlation Summary
| Measurement | Immigrants from Iraq | Panamanian |
| Minimum | 29.8% | 4.4% |
| Maximum | 77.9% | 73.1% |
| Range | 48.1% | 68.8% |
| Mean | 49.8% | 43.6% |
| Median | 47.9% | 45.6% |
| Interquartile 25% (IQ1) | 44.5% | 37.2% |
| Interquartile 75% (IQ3) | 53.9% | 51.9% |
| Interquartile Range (IQR) | 9.4% | 14.7% |
| Standard Deviation (Sample) | 8.9% | 14.2% |
| Standard Deviation (Population) | 8.8% | 14.0% |
Similar Demographics by Married-couple Households
Demographics Similar to Immigrants from Iraq by Married-couple Households
In terms of married-couple households, the demographic groups most similar to Immigrants from Iraq are Immigrants from Hungary (47.3%, a difference of 0.0%), Immigrants from Peru (47.3%, a difference of 0.010%), Immigrants from Denmark (47.3%, a difference of 0.020%), Celtic (47.3%, a difference of 0.030%), and Pakistani (47.3%, a difference of 0.070%).
| Demographics | Rating | Rank | Married-couple Households |
| Okinawans | 90.1 /100 | #122 | Exceptional 47.4% |
| Immigrants | Venezuela | 89.3 /100 | #123 | Excellent 47.4% |
| Zimbabweans | 89.2 /100 | #124 | Excellent 47.4% |
| Australians | 89.0 /100 | #125 | Excellent 47.4% |
| Pakistanis | 88.6 /100 | #126 | Excellent 47.3% |
| Celtics | 88.1 /100 | #127 | Excellent 47.3% |
| Immigrants | Peru | 87.9 /100 | #128 | Excellent 47.3% |
| Immigrants | Iraq | 87.8 /100 | #129 | Excellent 47.3% |
| Immigrants | Hungary | 87.8 /100 | #130 | Excellent 47.3% |
| Immigrants | Denmark | 87.5 /100 | #131 | Excellent 47.3% |
| Immigrants | Ukraine | 86.7 /100 | #132 | Excellent 47.3% |
| South Africans | 86.4 /100 | #133 | Excellent 47.3% |
| Immigrants | Greece | 86.0 /100 | #134 | Excellent 47.2% |
| Immigrants | Argentina | 86.0 /100 | #135 | Excellent 47.2% |
| New Zealanders | 85.3 /100 | #136 | Excellent 47.2% |
Demographics Similar to Panamanians by Married-couple Households
In terms of married-couple households, the demographic groups most similar to Panamanians are Immigrants from Nepal (45.2%, a difference of 0.020%), Immigrants from Portugal (45.2%, a difference of 0.020%), Immigrants from the Azores (45.2%, a difference of 0.030%), Nicaraguan (45.2%, a difference of 0.030%), and Japanese (45.2%, a difference of 0.040%).
| Demographics | Rating | Rank | Married-couple Households |
| Cubans | 7.7 /100 | #210 | Tragic 45.4% |
| Immigrants | Spain | 7.3 /100 | #211 | Tragic 45.3% |
| Creek | 6.4 /100 | #212 | Tragic 45.3% |
| Yakama | 5.8 /100 | #213 | Tragic 45.2% |
| Japanese | 5.7 /100 | #214 | Tragic 45.2% |
| Immigrants | Nepal | 5.6 /100 | #215 | Tragic 45.2% |
| Immigrants | Portugal | 5.6 /100 | #216 | Tragic 45.2% |
| Panamanians | 5.5 /100 | #217 | Tragic 45.2% |
| Immigrants | Azores | 5.3 /100 | #218 | Tragic 45.2% |
| Nicaraguans | 5.3 /100 | #219 | Tragic 45.2% |
| Immigrants | Thailand | 5.1 /100 | #220 | Tragic 45.2% |
| Tlingit-Haida | 4.9 /100 | #221 | Tragic 45.1% |
| Immigrants | Laos | 4.6 /100 | #222 | Tragic 45.1% |
| Immigrants | Cambodia | 2.7 /100 | #223 | Tragic 44.9% |
| Immigrants | Micronesia | 2.6 /100 | #224 | Tragic 44.9% |