Immigrants from Iraq vs Panamanian Ambulatory Disability
COMPARE
Immigrants from Iraq
Panamanian
Ambulatory Disability
Ambulatory Disability Comparison
Immigrants from Iraq
Panamanians
6.3%
AMBULATORY DISABILITY
14.0/ 100
METRIC RATING
209th/ 347
METRIC RANK
6.4%
AMBULATORY DISABILITY
3.1/ 100
METRIC RATING
231st/ 347
METRIC RANK
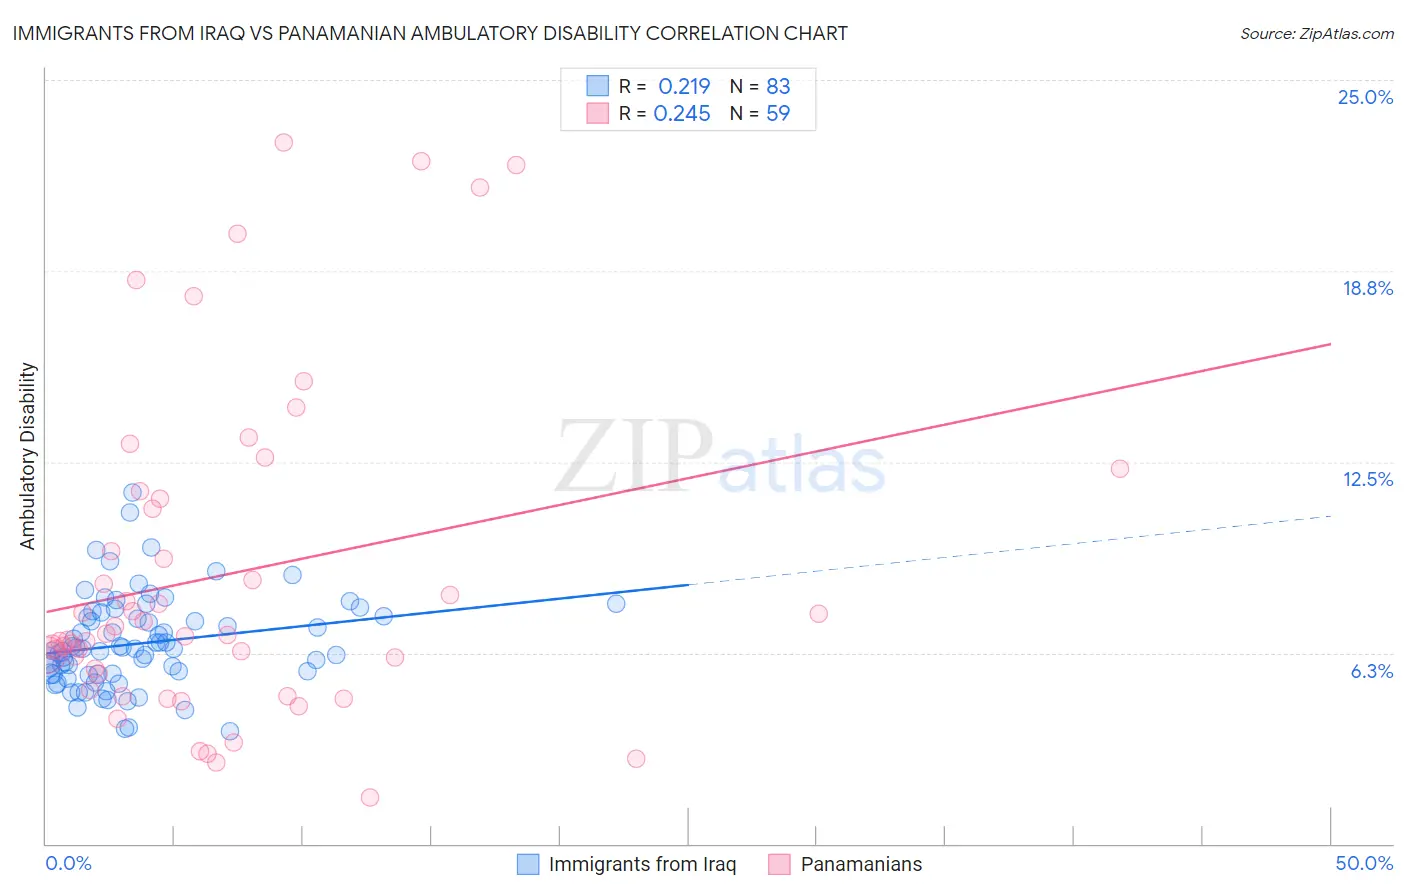
Immigrants from Iraq vs Panamanian Ambulatory Disability Correlation Chart
The statistical analysis conducted on geographies consisting of 194,765,362 people shows a weak positive correlation between the proportion of Immigrants from Iraq and percentage of population with ambulatory disability in the United States with a correlation coefficient (R) of 0.219 and weighted average of 6.3%. Similarly, the statistical analysis conducted on geographies consisting of 281,171,683 people shows a weak positive correlation between the proportion of Panamanians and percentage of population with ambulatory disability in the United States with a correlation coefficient (R) of 0.245 and weighted average of 6.4%, a difference of 2.1%.
Ambulatory Disability Correlation Summary
| Measurement | Immigrants from Iraq | Panamanian |
| Minimum | 3.7% | 1.5% |
| Maximum | 11.5% | 23.0% |
| Range | 7.8% | 21.5% |
| Mean | 6.6% | 8.8% |
| Median | 6.4% | 6.8% |
| Interquartile 25% (IQ1) | 5.6% | 5.6% |
| Interquartile 75% (IQ3) | 7.4% | 11.3% |
| Interquartile Range (IQR) | 1.9% | 5.7% |
| Standard Deviation (Sample) | 1.5% | 5.3% |
| Standard Deviation (Population) | 1.5% | 5.3% |
Similar Demographics by Ambulatory Disability
Demographics Similar to Immigrants from Iraq by Ambulatory Disability
In terms of ambulatory disability, the demographic groups most similar to Immigrants from Iraq are Bangladeshi (6.3%, a difference of 0.020%), Immigrants from Laos (6.3%, a difference of 0.080%), Alsatian (6.3%, a difference of 0.11%), Samoan (6.3%, a difference of 0.22%), and Mexican American Indian (6.3%, a difference of 0.23%).
| Demographics | Rating | Rank | Ambulatory Disability |
| Albanians | 19.7 /100 | #202 | Poor 6.2% |
| Immigrants | Ukraine | 18.4 /100 | #203 | Poor 6.2% |
| Immigrants | Congo | 18.2 /100 | #204 | Poor 6.2% |
| Slovenes | 18.0 /100 | #205 | Poor 6.2% |
| Finns | 17.2 /100 | #206 | Poor 6.2% |
| Alsatians | 15.1 /100 | #207 | Poor 6.3% |
| Bangladeshis | 14.2 /100 | #208 | Poor 6.3% |
| Immigrants | Iraq | 14.0 /100 | #209 | Poor 6.3% |
| Immigrants | Laos | 13.2 /100 | #210 | Poor 6.3% |
| Samoans | 12.1 /100 | #211 | Poor 6.3% |
| Mexican American Indians | 12.0 /100 | #212 | Poor 6.3% |
| Japanese | 12.0 /100 | #213 | Poor 6.3% |
| Immigrants | Mexico | 11.0 /100 | #214 | Poor 6.3% |
| Immigrants | Latin America | 11.0 /100 | #215 | Poor 6.3% |
| Canadians | 10.9 /100 | #216 | Poor 6.3% |
Demographics Similar to Panamanians by Ambulatory Disability
In terms of ambulatory disability, the demographic groups most similar to Panamanians are Mexican (6.4%, a difference of 0.16%), Czechoslovakian (6.4%, a difference of 0.26%), Portuguese (6.4%, a difference of 0.31%), Cuban (6.4%, a difference of 0.32%), and Assyrian/Chaldean/Syriac (6.4%, a difference of 0.33%).
| Demographics | Rating | Rank | Ambulatory Disability |
| Liberians | 7.1 /100 | #224 | Tragic 6.3% |
| Hondurans | 6.3 /100 | #225 | Tragic 6.3% |
| Slavs | 5.1 /100 | #226 | Tragic 6.4% |
| Cubans | 4.0 /100 | #227 | Tragic 6.4% |
| Portuguese | 4.0 /100 | #228 | Tragic 6.4% |
| Czechoslovakians | 3.8 /100 | #229 | Tragic 6.4% |
| Mexicans | 3.5 /100 | #230 | Tragic 6.4% |
| Panamanians | 3.1 /100 | #231 | Tragic 6.4% |
| Assyrians/Chaldeans/Syriacs | 2.4 /100 | #232 | Tragic 6.4% |
| Sub-Saharan Africans | 2.3 /100 | #233 | Tragic 6.4% |
| Immigrants | Liberia | 2.3 /100 | #234 | Tragic 6.4% |
| Hispanics or Latinos | 2.2 /100 | #235 | Tragic 6.4% |
| Dutch | 2.0 /100 | #236 | Tragic 6.4% |
| Immigrants | Germany | 1.8 /100 | #237 | Tragic 6.4% |
| Haitians | 1.8 /100 | #238 | Tragic 6.4% |