Immigrants from Iran vs Immigrants from Philippines Unemployment Among Women with Children Under 18 years
COMPARE
Immigrants from Iran
Immigrants from Philippines
Unemployment Among Women with Children Under 18 years
Unemployment Among Women with Children Under 18 years Comparison
Immigrants from Iran
Immigrants from Philippines
5.4%
UNEMPLOYMENT AMONG WOMEN WITH CHILDREN UNDER 18 YEARS
71.1/ 100
METRIC RATING
151st/ 347
METRIC RANK
5.4%
UNEMPLOYMENT AMONG WOMEN WITH CHILDREN UNDER 18 YEARS
53.1/ 100
METRIC RATING
171st/ 347
METRIC RANK
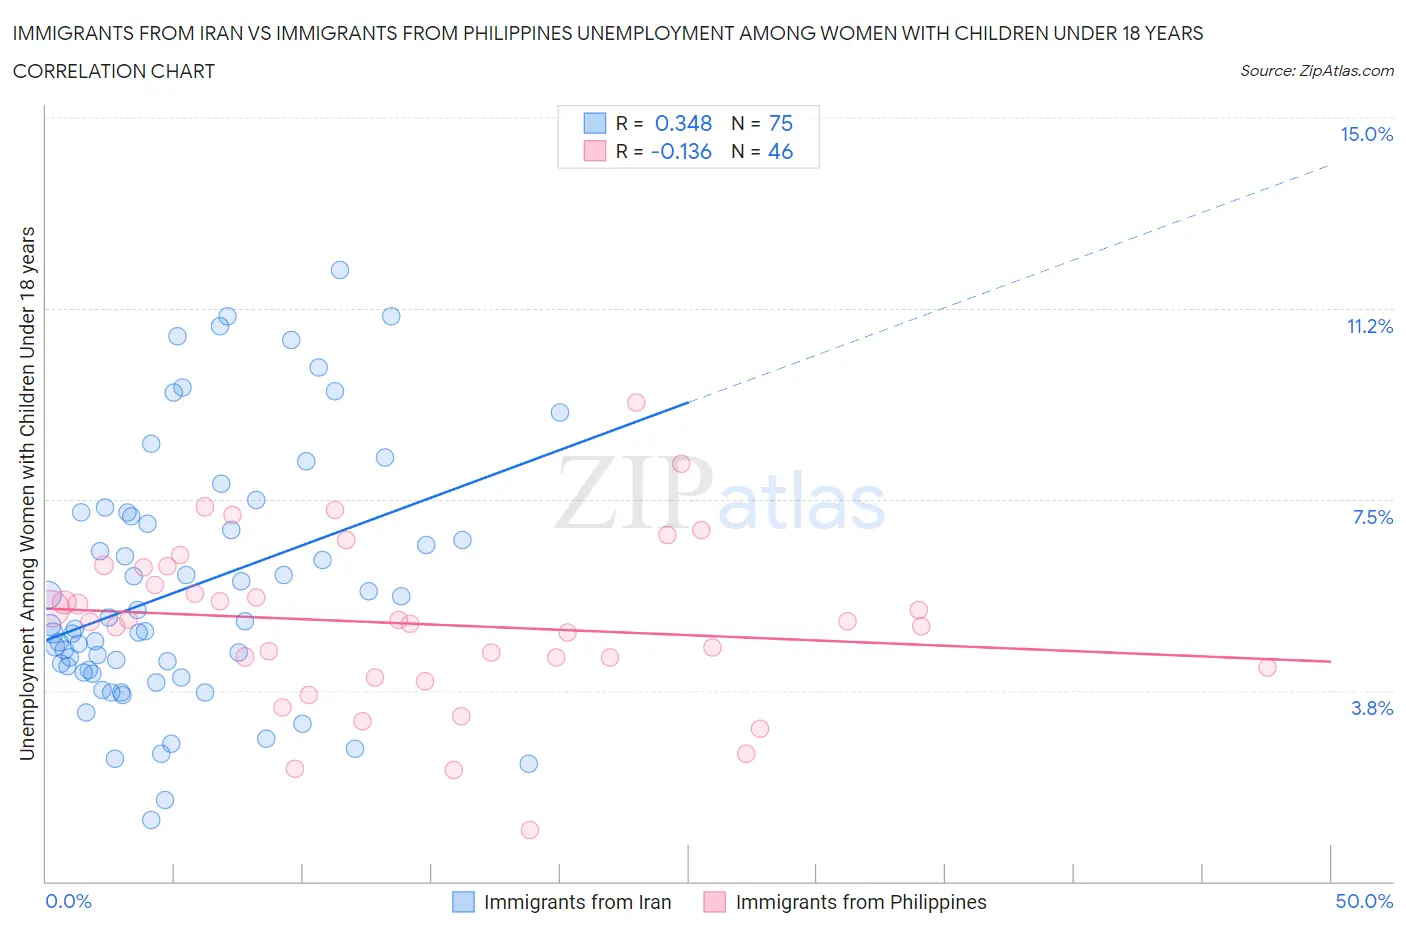
Immigrants from Iran vs Immigrants from Philippines Unemployment Among Women with Children Under 18 years Correlation Chart
The statistical analysis conducted on geographies consisting of 272,933,187 people shows a mild positive correlation between the proportion of Immigrants from Iran and unemployment rate among women with children under the age of 18 in the United States with a correlation coefficient (R) of 0.348 and weighted average of 5.4%. Similarly, the statistical analysis conducted on geographies consisting of 447,841,859 people shows a poor negative correlation between the proportion of Immigrants from Philippines and unemployment rate among women with children under the age of 18 in the United States with a correlation coefficient (R) of -0.136 and weighted average of 5.4%, a difference of 1.4%.
Unemployment Among Women with Children Under 18 years Correlation Summary
| Measurement | Immigrants from Iran | Immigrants from Philippines |
| Minimum | 1.2% | 1.0% |
| Maximum | 12.0% | 9.4% |
| Range | 10.8% | 8.4% |
| Mean | 5.8% | 5.1% |
| Median | 5.0% | 5.1% |
| Interquartile 25% (IQ1) | 4.1% | 4.2% |
| Interquartile 75% (IQ3) | 7.2% | 6.2% |
| Interquartile Range (IQR) | 3.1% | 2.0% |
| Standard Deviation (Sample) | 2.5% | 1.6% |
| Standard Deviation (Population) | 2.5% | 1.6% |
Demographics Similar to Immigrants from Iran and Immigrants from Philippines by Unemployment Among Women with Children Under 18 years
In terms of unemployment among women with children under 18 years, the demographic groups most similar to Immigrants from Iran are Immigrants from South Eastern Asia (5.4%, a difference of 0.010%), Carpatho Rusyn (5.4%, a difference of 0.030%), Immigrants from Latvia (5.4%, a difference of 0.030%), Korean (5.4%, a difference of 0.050%), and South African (5.4%, a difference of 0.070%). Similarly, the demographic groups most similar to Immigrants from Philippines are Samoan (5.4%, a difference of 0.070%), Immigrants from Thailand (5.4%, a difference of 0.16%), Immigrants from Northern Africa (5.4%, a difference of 0.21%), Immigrants from Denmark (5.4%, a difference of 0.35%), and Aleut (5.4%, a difference of 0.46%).
| Demographics | Rating | Rank | Unemployment Among Women with Children Under 18 years |
| Immigrants | Iran | 71.1 /100 | #151 | Good 5.4% |
| Immigrants | South Eastern Asia | 71.1 /100 | #152 | Good 5.4% |
| Carpatho Rusyns | 70.8 /100 | #153 | Good 5.4% |
| Immigrants | Latvia | 70.8 /100 | #154 | Good 5.4% |
| Koreans | 70.5 /100 | #155 | Good 5.4% |
| South Africans | 70.3 /100 | #156 | Good 5.4% |
| German Russians | 70.2 /100 | #157 | Good 5.4% |
| Immigrants | Burma/Myanmar | 69.5 /100 | #158 | Good 5.4% |
| Chickasaw | 68.4 /100 | #159 | Good 5.4% |
| Afghans | 66.6 /100 | #160 | Good 5.4% |
| Immigrants | Iraq | 65.9 /100 | #161 | Good 5.4% |
| Immigrants | Saudi Arabia | 65.0 /100 | #162 | Good 5.4% |
| Lebanese | 64.7 /100 | #163 | Good 5.4% |
| Celtics | 63.0 /100 | #164 | Good 5.4% |
| Tlingit-Haida | 61.9 /100 | #165 | Good 5.4% |
| Aleuts | 59.4 /100 | #166 | Average 5.4% |
| Immigrants | Denmark | 58.0 /100 | #167 | Average 5.4% |
| Immigrants | Northern Africa | 56.1 /100 | #168 | Average 5.4% |
| Immigrants | Thailand | 55.3 /100 | #169 | Average 5.4% |
| Samoans | 54.1 /100 | #170 | Average 5.4% |
| Immigrants | Philippines | 53.1 /100 | #171 | Average 5.4% |