Immigrants from Indonesia vs Thai Unemployment Among Seniors over 75 years
COMPARE
Immigrants from Indonesia
Thai
Unemployment Among Seniors over 75 years
Unemployment Among Seniors over 75 years Comparison
Immigrants from Indonesia
Thais
8.1%
UNEMPLOYMENT AMONG SENIORS OVER 75 YEARS
99.7/ 100
METRIC RATING
85th/ 347
METRIC RANK
8.3%
UNEMPLOYMENT AMONG SENIORS OVER 75 YEARS
96.8/ 100
METRIC RATING
124th/ 347
METRIC RANK
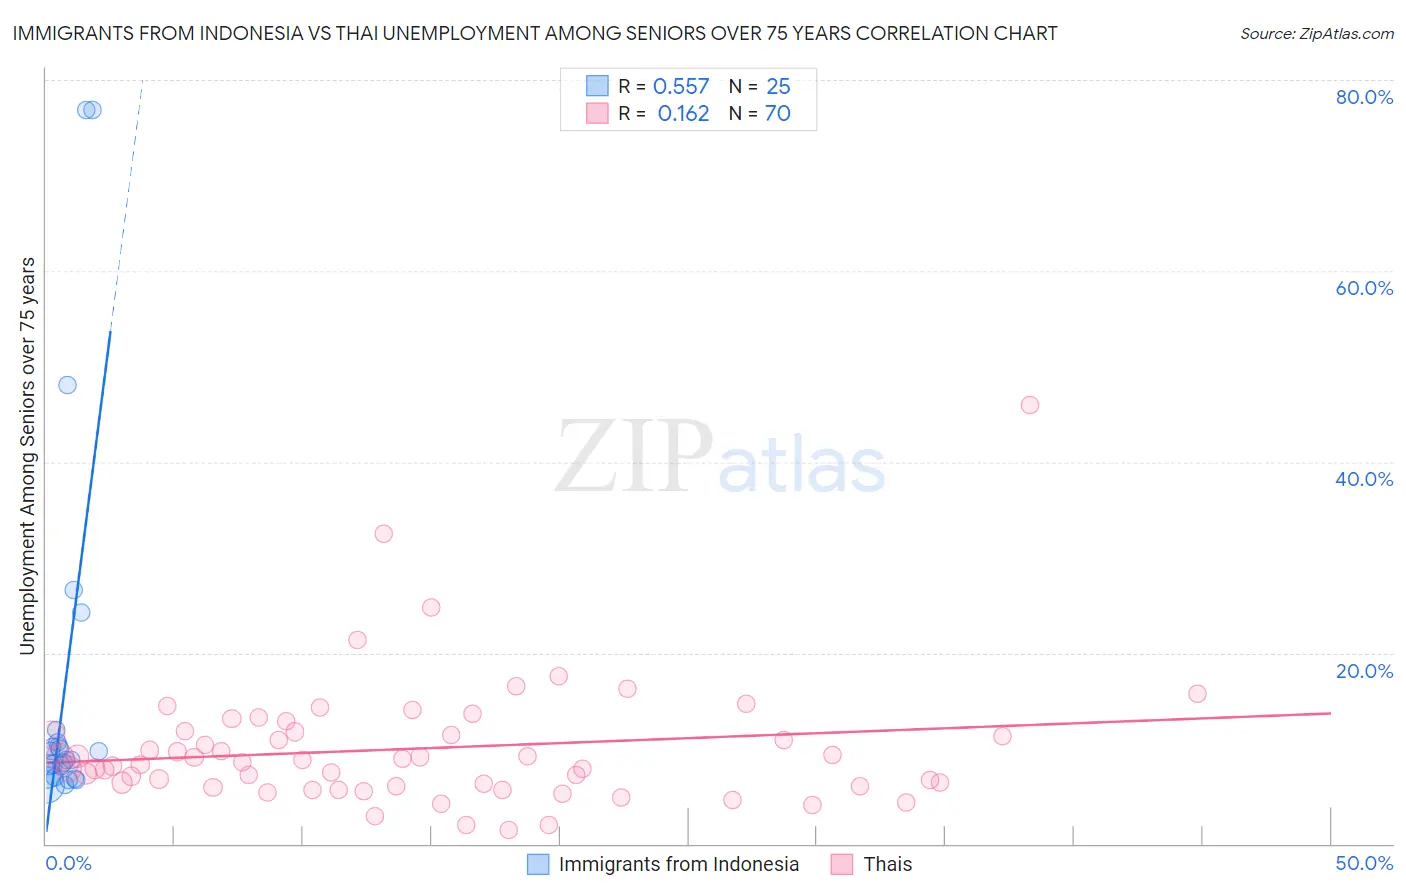
Immigrants from Indonesia vs Thai Unemployment Among Seniors over 75 years Correlation Chart
The statistical analysis conducted on geographies consisting of 139,408,466 people shows a substantial positive correlation between the proportion of Immigrants from Indonesia and unemployment rate among seniors over the age of 75 in the United States with a correlation coefficient (R) of 0.557 and weighted average of 8.1%. Similarly, the statistical analysis conducted on geographies consisting of 223,012,575 people shows a poor positive correlation between the proportion of Thais and unemployment rate among seniors over the age of 75 in the United States with a correlation coefficient (R) of 0.162 and weighted average of 8.3%, a difference of 3.4%.
Unemployment Among Seniors over 75 years Correlation Summary
| Measurement | Immigrants from Indonesia | Thai |
| Minimum | 6.2% | 1.5% |
| Maximum | 76.9% | 45.9% |
| Range | 70.7% | 44.4% |
| Mean | 16.9% | 10.0% |
| Median | 8.8% | 8.6% |
| Interquartile 25% (IQ1) | 7.1% | 6.0% |
| Interquartile 75% (IQ3) | 11.3% | 11.7% |
| Interquartile Range (IQR) | 4.2% | 5.7% |
| Standard Deviation (Sample) | 20.2% | 6.8% |
| Standard Deviation (Population) | 19.8% | 6.7% |
Similar Demographics by Unemployment Among Seniors over 75 years
Demographics Similar to Immigrants from Indonesia by Unemployment Among Seniors over 75 years
In terms of unemployment among seniors over 75 years, the demographic groups most similar to Immigrants from Indonesia are U.S. Virgin Islander (8.1%, a difference of 0.060%), Immigrants from Singapore (8.1%, a difference of 0.090%), Arapaho (8.1%, a difference of 0.14%), Bhutanese (8.0%, a difference of 0.25%), and Cuban (8.0%, a difference of 0.27%).
| Demographics | Rating | Rank | Unemployment Among Seniors over 75 years |
| Immigrants | Belarus | 99.8 /100 | #78 | Exceptional 8.0% |
| Immigrants | Japan | 99.7 /100 | #79 | Exceptional 8.0% |
| Immigrants | Australia | 99.7 /100 | #80 | Exceptional 8.0% |
| Cubans | 99.7 /100 | #81 | Exceptional 8.0% |
| Bhutanese | 99.7 /100 | #82 | Exceptional 8.0% |
| Arapaho | 99.7 /100 | #83 | Exceptional 8.1% |
| U.S. Virgin Islanders | 99.7 /100 | #84 | Exceptional 8.1% |
| Immigrants | Indonesia | 99.7 /100 | #85 | Exceptional 8.1% |
| Immigrants | Singapore | 99.7 /100 | #86 | Exceptional 8.1% |
| Basques | 99.5 /100 | #87 | Exceptional 8.1% |
| New Zealanders | 99.5 /100 | #88 | Exceptional 8.1% |
| Immigrants | Korea | 99.5 /100 | #89 | Exceptional 8.1% |
| Immigrants | Vietnam | 99.5 /100 | #90 | Exceptional 8.1% |
| Egyptians | 99.5 /100 | #91 | Exceptional 8.1% |
| Venezuelans | 99.5 /100 | #92 | Exceptional 8.1% |
Demographics Similar to Thais by Unemployment Among Seniors over 75 years
In terms of unemployment among seniors over 75 years, the demographic groups most similar to Thais are Immigrants from Moldova (8.3%, a difference of 0.020%), Immigrants from Nepal (8.3%, a difference of 0.040%), Immigrants from Russia (8.3%, a difference of 0.12%), Immigrants from Croatia (8.3%, a difference of 0.19%), and Belizean (8.4%, a difference of 0.22%).
| Demographics | Rating | Rank | Unemployment Among Seniors over 75 years |
| Immigrants | Greece | 97.9 /100 | #117 | Exceptional 8.3% |
| Immigrants | Middle Africa | 97.9 /100 | #118 | Exceptional 8.3% |
| Japanese | 97.5 /100 | #119 | Exceptional 8.3% |
| Immigrants | Asia | 97.4 /100 | #120 | Exceptional 8.3% |
| Immigrants | Croatia | 97.2 /100 | #121 | Exceptional 8.3% |
| Immigrants | Russia | 97.1 /100 | #122 | Exceptional 8.3% |
| Immigrants | Nepal | 96.9 /100 | #123 | Exceptional 8.3% |
| Thais | 96.8 /100 | #124 | Exceptional 8.3% |
| Immigrants | Moldova | 96.7 /100 | #125 | Exceptional 8.3% |
| Belizeans | 96.3 /100 | #126 | Exceptional 8.4% |
| Hondurans | 96.2 /100 | #127 | Exceptional 8.4% |
| Native Hawaiians | 96.1 /100 | #128 | Exceptional 8.4% |
| Ghanaians | 96.0 /100 | #129 | Exceptional 8.4% |
| Apache | 95.2 /100 | #130 | Exceptional 8.4% |
| German Russians | 94.9 /100 | #131 | Exceptional 8.4% |