Immigrants from India vs Immigrants from Korea Disability Age 35 to 64
COMPARE
Immigrants from India
Immigrants from Korea
Disability Age 35 to 64
Disability Age 35 to 64 Comparison
Immigrants from India
Immigrants from Korea
8.3%
DISABILITY AGE 35 TO 64
100.0/ 100
METRIC RATING
4th/ 347
METRIC RANK
9.0%
DISABILITY AGE 35 TO 64
100.0/ 100
METRIC RATING
16th/ 347
METRIC RANK
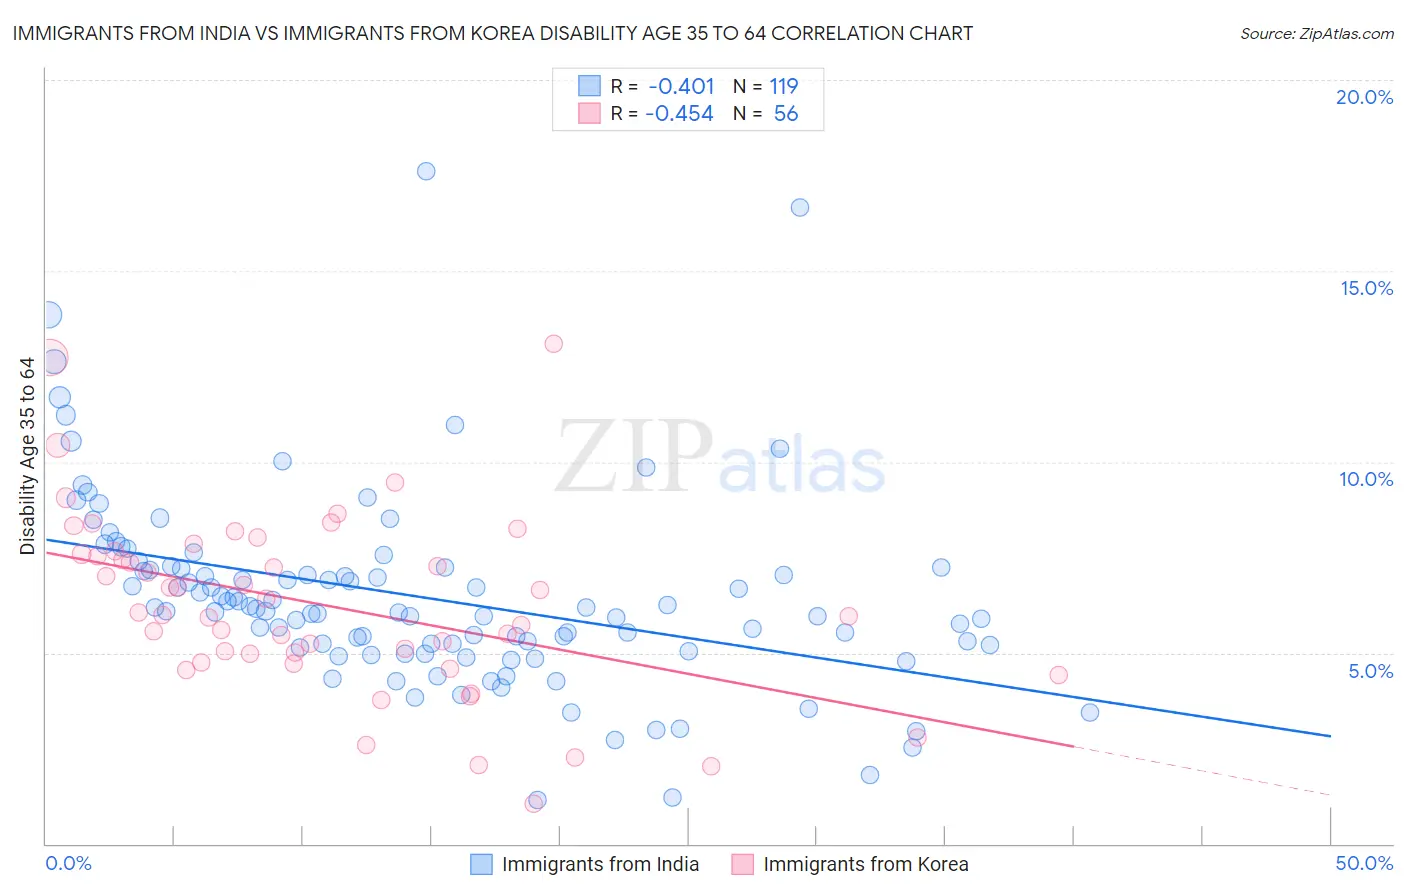
Immigrants from India vs Immigrants from Korea Disability Age 35 to 64 Correlation Chart
The statistical analysis conducted on geographies consisting of 433,679,908 people shows a moderate negative correlation between the proportion of Immigrants from India and percentage of population with a disability between the ages 34 and 64 in the United States with a correlation coefficient (R) of -0.401 and weighted average of 8.3%. Similarly, the statistical analysis conducted on geographies consisting of 415,929,521 people shows a moderate negative correlation between the proportion of Immigrants from Korea and percentage of population with a disability between the ages 34 and 64 in the United States with a correlation coefficient (R) of -0.454 and weighted average of 9.0%, a difference of 8.3%.
Disability Age 35 to 64 Correlation Summary
| Measurement | Immigrants from India | Immigrants from Korea |
| Minimum | 1.1% | 1.0% |
| Maximum | 17.6% | 13.1% |
| Range | 16.5% | 12.0% |
| Mean | 6.5% | 6.3% |
| Median | 6.1% | 6.0% |
| Interquartile 25% (IQ1) | 5.1% | 4.9% |
| Interquartile 75% (IQ3) | 7.2% | 7.6% |
| Interquartile Range (IQR) | 2.1% | 2.8% |
| Standard Deviation (Sample) | 2.6% | 2.4% |
| Standard Deviation (Population) | 2.6% | 2.4% |
Demographics Similar to Immigrants from India and Immigrants from Korea by Disability Age 35 to 64
In terms of disability age 35 to 64, the demographic groups most similar to Immigrants from India are Immigrants from Hong Kong (8.2%, a difference of 1.1%), Immigrants from Iran (8.5%, a difference of 2.5%), Filipino (8.0%, a difference of 2.9%), Thai (8.6%, a difference of 3.5%), and Immigrants from Israel (8.6%, a difference of 4.0%). Similarly, the demographic groups most similar to Immigrants from Korea are Bolivian (8.9%, a difference of 0.34%), Immigrants from Singapore (8.9%, a difference of 0.63%), Immigrants from South Central Asia (8.9%, a difference of 1.2%), Indian (Asian) (8.9%, a difference of 1.3%), and Immigrants from Eastern Asia (8.8%, a difference of 2.1%).
| Demographics | Rating | Rank | Disability Age 35 to 64 |
| Immigrants | Taiwan | 100.0 /100 | #1 | Exceptional 7.8% |
| Filipinos | 100.0 /100 | #2 | Exceptional 8.0% |
| Immigrants | Hong Kong | 100.0 /100 | #3 | Exceptional 8.2% |
| Immigrants | India | 100.0 /100 | #4 | Exceptional 8.3% |
| Immigrants | Iran | 100.0 /100 | #5 | Exceptional 8.5% |
| Thais | 100.0 /100 | #6 | Exceptional 8.6% |
| Immigrants | Israel | 100.0 /100 | #7 | Exceptional 8.6% |
| Iranians | 100.0 /100 | #8 | Exceptional 8.7% |
| Immigrants | China | 100.0 /100 | #9 | Exceptional 8.7% |
| Immigrants | Bolivia | 100.0 /100 | #10 | Exceptional 8.7% |
| Immigrants | Eastern Asia | 100.0 /100 | #11 | Exceptional 8.8% |
| Indians (Asian) | 100.0 /100 | #12 | Exceptional 8.9% |
| Immigrants | South Central Asia | 100.0 /100 | #13 | Exceptional 8.9% |
| Immigrants | Singapore | 100.0 /100 | #14 | Exceptional 8.9% |
| Bolivians | 100.0 /100 | #15 | Exceptional 8.9% |
| Immigrants | Korea | 100.0 /100 | #16 | Exceptional 9.0% |
| Burmese | 100.0 /100 | #17 | Exceptional 9.2% |
| Soviet Union | 100.0 /100 | #18 | Exceptional 9.2% |
| Immigrants | Venezuela | 100.0 /100 | #19 | Exceptional 9.3% |
| Immigrants | Argentina | 100.0 /100 | #20 | Exceptional 9.3% |