Immigrants from India vs Immigrants from Korea Unemployment Among Ages 25 to 29 years
COMPARE
Immigrants from India
Immigrants from Korea
Unemployment Among Ages 25 to 29 years
Unemployment Among Ages 25 to 29 years Comparison
Immigrants from India
Immigrants from Korea
5.7%
UNEMPLOYMENT AMONG AGES 25 TO 29 YEARS
100.0/ 100
METRIC RATING
7th/ 347
METRIC RANK
6.3%
UNEMPLOYMENT AMONG AGES 25 TO 29 YEARS
96.7/ 100
METRIC RATING
76th/ 347
METRIC RANK
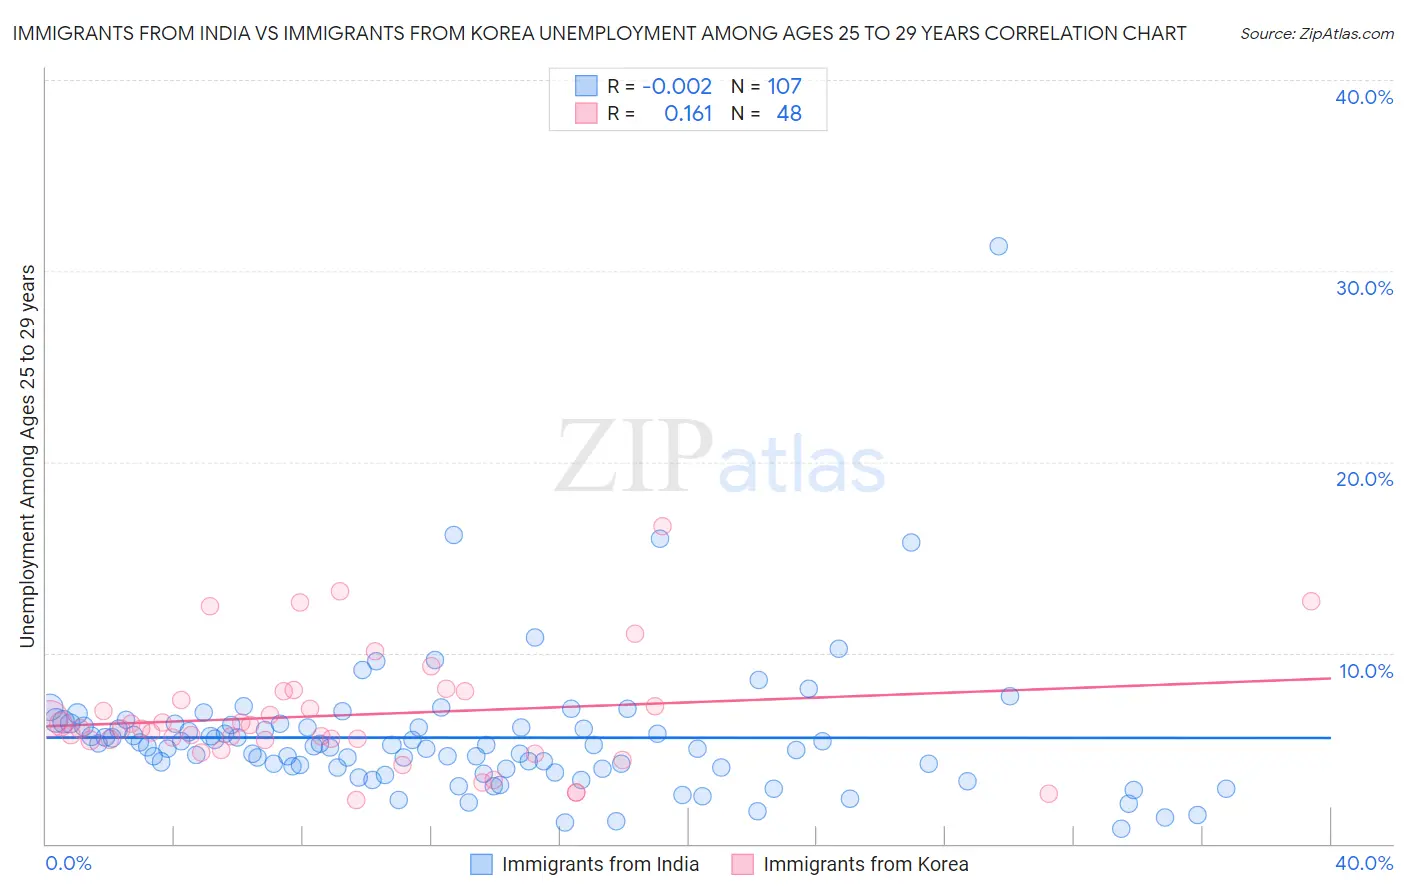
Immigrants from India vs Immigrants from Korea Unemployment Among Ages 25 to 29 years Correlation Chart
The statistical analysis conducted on geographies consisting of 410,894,390 people shows no correlation between the proportion of Immigrants from India and unemployment rate among population between the ages 25 and 29 in the United States with a correlation coefficient (R) of -0.002 and weighted average of 5.7%. Similarly, the statistical analysis conducted on geographies consisting of 395,049,310 people shows a poor positive correlation between the proportion of Immigrants from Korea and unemployment rate among population between the ages 25 and 29 in the United States with a correlation coefficient (R) of 0.161 and weighted average of 6.3%, a difference of 11.3%.
Unemployment Among Ages 25 to 29 years Correlation Summary
| Measurement | Immigrants from India | Immigrants from Korea |
| Minimum | 0.80% | 2.3% |
| Maximum | 31.3% | 16.6% |
| Range | 30.5% | 14.3% |
| Mean | 5.6% | 6.7% |
| Median | 5.1% | 6.0% |
| Interquartile 25% (IQ1) | 3.9% | 5.4% |
| Interquartile 75% (IQ3) | 6.2% | 7.8% |
| Interquartile Range (IQR) | 2.3% | 2.3% |
| Standard Deviation (Sample) | 3.6% | 3.0% |
| Standard Deviation (Population) | 3.6% | 3.0% |
Similar Demographics by Unemployment Among Ages 25 to 29 years
Demographics Similar to Immigrants from India by Unemployment Among Ages 25 to 29 years
In terms of unemployment among ages 25 to 29 years, the demographic groups most similar to Immigrants from India are Hmong (5.7%, a difference of 0.080%), Immigrants from Bosnia and Herzegovina (5.7%, a difference of 0.12%), Somali (5.6%, a difference of 0.27%), Immigrants from Cuba (5.6%, a difference of 0.34%), and Immigrants from Nepal (5.7%, a difference of 1.4%).
| Demographics | Rating | Rank | Unemployment Among Ages 25 to 29 years |
| Sudanese | 100.0 /100 | #1 | Exceptional 5.4% |
| Tongans | 100.0 /100 | #2 | Exceptional 5.5% |
| Immigrants | Somalia | 100.0 /100 | #3 | Exceptional 5.5% |
| Immigrants | Cuba | 100.0 /100 | #4 | Exceptional 5.6% |
| Somalis | 100.0 /100 | #5 | Exceptional 5.6% |
| Hmong | 100.0 /100 | #6 | Exceptional 5.7% |
| Immigrants | India | 100.0 /100 | #7 | Exceptional 5.7% |
| Immigrants | Bosnia and Herzegovina | 100.0 /100 | #8 | Exceptional 5.7% |
| Immigrants | Nepal | 100.0 /100 | #9 | Exceptional 5.7% |
| Immigrants | Sudan | 100.0 /100 | #10 | Exceptional 5.8% |
| Cambodians | 100.0 /100 | #11 | Exceptional 5.8% |
| Okinawans | 100.0 /100 | #12 | Exceptional 5.9% |
| Immigrants | Bolivia | 100.0 /100 | #13 | Exceptional 5.9% |
| Immigrants | Kuwait | 99.9 /100 | #14 | Exceptional 5.9% |
| Cubans | 99.9 /100 | #15 | Exceptional 5.9% |
Demographics Similar to Immigrants from Korea by Unemployment Among Ages 25 to 29 years
In terms of unemployment among ages 25 to 29 years, the demographic groups most similar to Immigrants from Korea are Icelander (6.3%, a difference of 0.020%), Immigrants from Jordan (6.3%, a difference of 0.060%), Asian (6.3%, a difference of 0.12%), Carpatho Rusyn (6.3%, a difference of 0.13%), and Belgian (6.3%, a difference of 0.16%).
| Demographics | Rating | Rank | Unemployment Among Ages 25 to 29 years |
| Immigrants | Hong Kong | 97.5 /100 | #69 | Exceptional 6.3% |
| Immigrants | Malaysia | 97.5 /100 | #70 | Exceptional 6.3% |
| Immigrants | France | 97.4 /100 | #71 | Exceptional 6.3% |
| Scandinavians | 97.4 /100 | #72 | Exceptional 6.3% |
| Belgians | 97.0 /100 | #73 | Exceptional 6.3% |
| Carpatho Rusyns | 96.9 /100 | #74 | Exceptional 6.3% |
| Immigrants | Jordan | 96.8 /100 | #75 | Exceptional 6.3% |
| Immigrants | Korea | 96.7 /100 | #76 | Exceptional 6.3% |
| Icelanders | 96.6 /100 | #77 | Exceptional 6.3% |
| Asians | 96.4 /100 | #78 | Exceptional 6.3% |
| Immigrants | Switzerland | 96.0 /100 | #79 | Exceptional 6.3% |
| Immigrants | Romania | 95.9 /100 | #80 | Exceptional 6.3% |
| Iranians | 95.8 /100 | #81 | Exceptional 6.3% |
| Immigrants | Poland | 95.7 /100 | #82 | Exceptional 6.3% |
| Slovenes | 95.3 /100 | #83 | Exceptional 6.3% |