Immigrants from Hong Kong vs Finnish Currently Married
COMPARE
Immigrants from Hong Kong
Finnish
Currently Married
Currently Married Comparison
Immigrants from Hong Kong
Finns
48.9%
CURRENTLY MARRIED
99.5/ 100
METRIC RATING
32nd/ 347
METRIC RANK
48.8%
CURRENTLY MARRIED
99.3/ 100
METRIC RATING
42nd/ 347
METRIC RANK
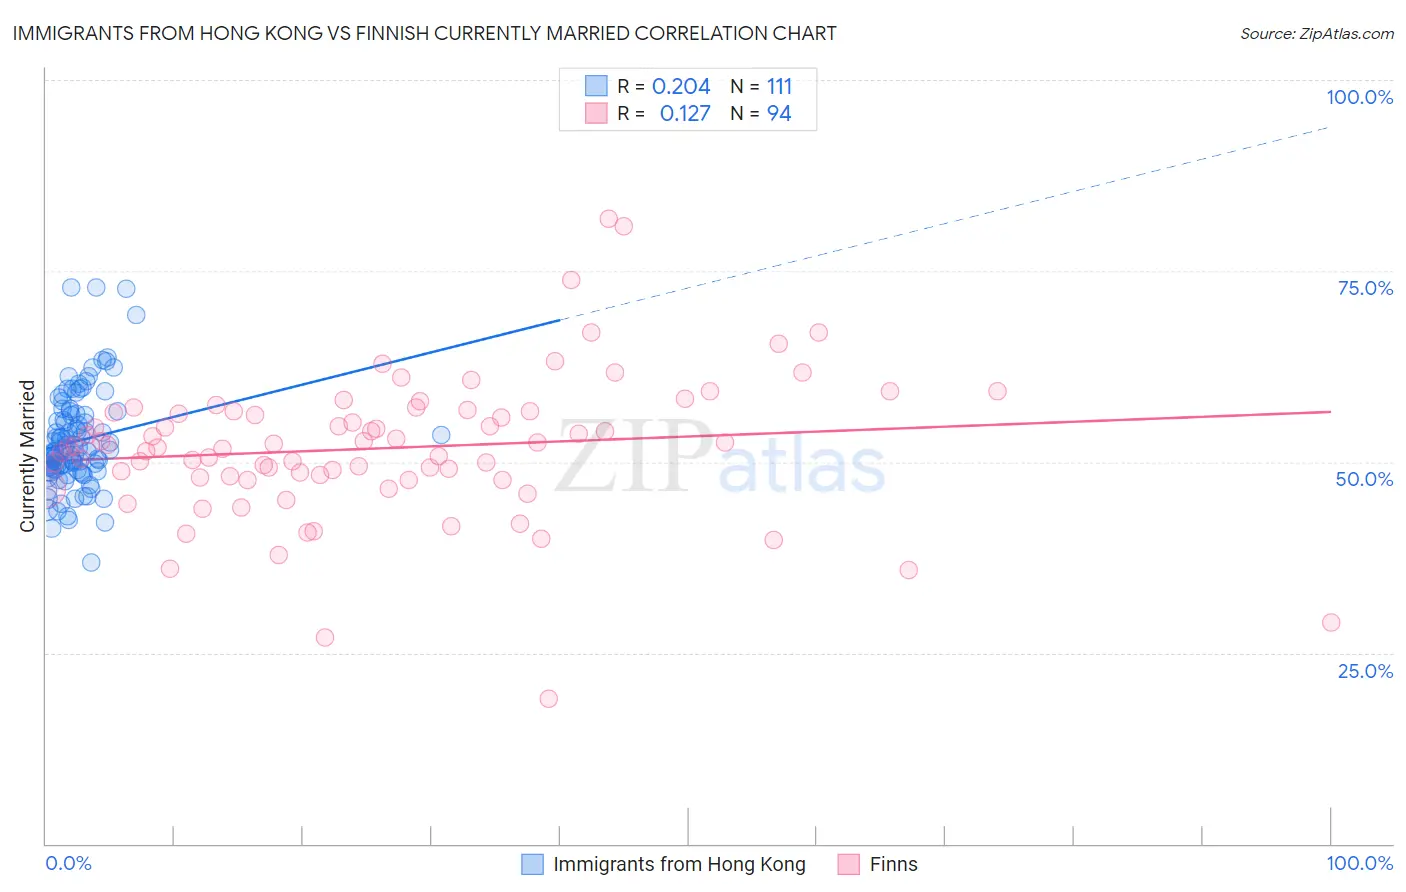
Immigrants from Hong Kong vs Finnish Currently Married Correlation Chart
The statistical analysis conducted on geographies consisting of 253,978,076 people shows a weak positive correlation between the proportion of Immigrants from Hong Kong and percentage of population currently married in the United States with a correlation coefficient (R) of 0.204 and weighted average of 48.9%. Similarly, the statistical analysis conducted on geographies consisting of 404,666,333 people shows a poor positive correlation between the proportion of Finns and percentage of population currently married in the United States with a correlation coefficient (R) of 0.127 and weighted average of 48.8%, a difference of 0.29%.
Currently Married Correlation Summary
| Measurement | Immigrants from Hong Kong | Finnish |
| Minimum | 36.9% | 19.0% |
| Maximum | 72.8% | 81.8% |
| Range | 35.9% | 62.8% |
| Mean | 52.7% | 51.8% |
| Median | 51.5% | 52.0% |
| Interquartile 25% (IQ1) | 49.0% | 47.9% |
| Interquartile 75% (IQ3) | 56.1% | 56.6% |
| Interquartile Range (IQR) | 7.1% | 8.7% |
| Standard Deviation (Sample) | 6.4% | 9.5% |
| Standard Deviation (Population) | 6.4% | 9.4% |
Demographics Similar to Immigrants from Hong Kong and Finns by Currently Married
In terms of currently married, the demographic groups most similar to Immigrants from Hong Kong are Eastern European (48.9%, a difference of 0.010%), Polish (48.9%, a difference of 0.010%), Croatian (48.9%, a difference of 0.020%), Irish (48.9%, a difference of 0.040%), and Welsh (48.9%, a difference of 0.070%). Similarly, the demographic groups most similar to Finns are Scotch-Irish (48.7%, a difference of 0.010%), Immigrants from North America (48.7%, a difference of 0.040%), Greek (48.8%, a difference of 0.050%), Immigrants from Canada (48.8%, a difference of 0.060%), and Belgian (48.7%, a difference of 0.060%).
| Demographics | Rating | Rank | Currently Married |
| Burmese | 99.6 /100 | #27 | Exceptional 48.9% |
| Welsh | 99.5 /100 | #28 | Exceptional 48.9% |
| Croatians | 99.5 /100 | #29 | Exceptional 48.9% |
| Eastern Europeans | 99.5 /100 | #30 | Exceptional 48.9% |
| Poles | 99.5 /100 | #31 | Exceptional 48.9% |
| Immigrants | Hong Kong | 99.5 /100 | #32 | Exceptional 48.9% |
| Irish | 99.5 /100 | #33 | Exceptional 48.9% |
| Immigrants | Lithuania | 99.4 /100 | #34 | Exceptional 48.8% |
| Immigrants | Northern Europe | 99.4 /100 | #35 | Exceptional 48.8% |
| Italians | 99.4 /100 | #36 | Exceptional 48.8% |
| Hungarians | 99.4 /100 | #37 | Exceptional 48.8% |
| Czechoslovakians | 99.4 /100 | #38 | Exceptional 48.8% |
| British | 99.4 /100 | #39 | Exceptional 48.8% |
| Immigrants | Canada | 99.4 /100 | #40 | Exceptional 48.8% |
| Greeks | 99.3 /100 | #41 | Exceptional 48.8% |
| Finns | 99.3 /100 | #42 | Exceptional 48.8% |
| Scotch-Irish | 99.3 /100 | #43 | Exceptional 48.7% |
| Immigrants | North America | 99.3 /100 | #44 | Exceptional 48.7% |
| Belgians | 99.3 /100 | #45 | Exceptional 48.7% |
| Immigrants | Iran | 99.2 /100 | #46 | Exceptional 48.7% |
| Northern Europeans | 99.2 /100 | #47 | Exceptional 48.7% |