Immigrants from Guatemala vs Spanish American Indian Single Mother Households
COMPARE
Immigrants from Guatemala
Spanish American Indian
Single Mother Households
Single Mother Households Comparison
Immigrants from Guatemala
Spanish American Indians
7.7%
SINGLE MOTHER HOUSEHOLDS
0.0/ 100
METRIC RATING
287th/ 347
METRIC RANK
7.3%
SINGLE MOTHER HOUSEHOLDS
0.4/ 100
METRIC RATING
248th/ 347
METRIC RANK
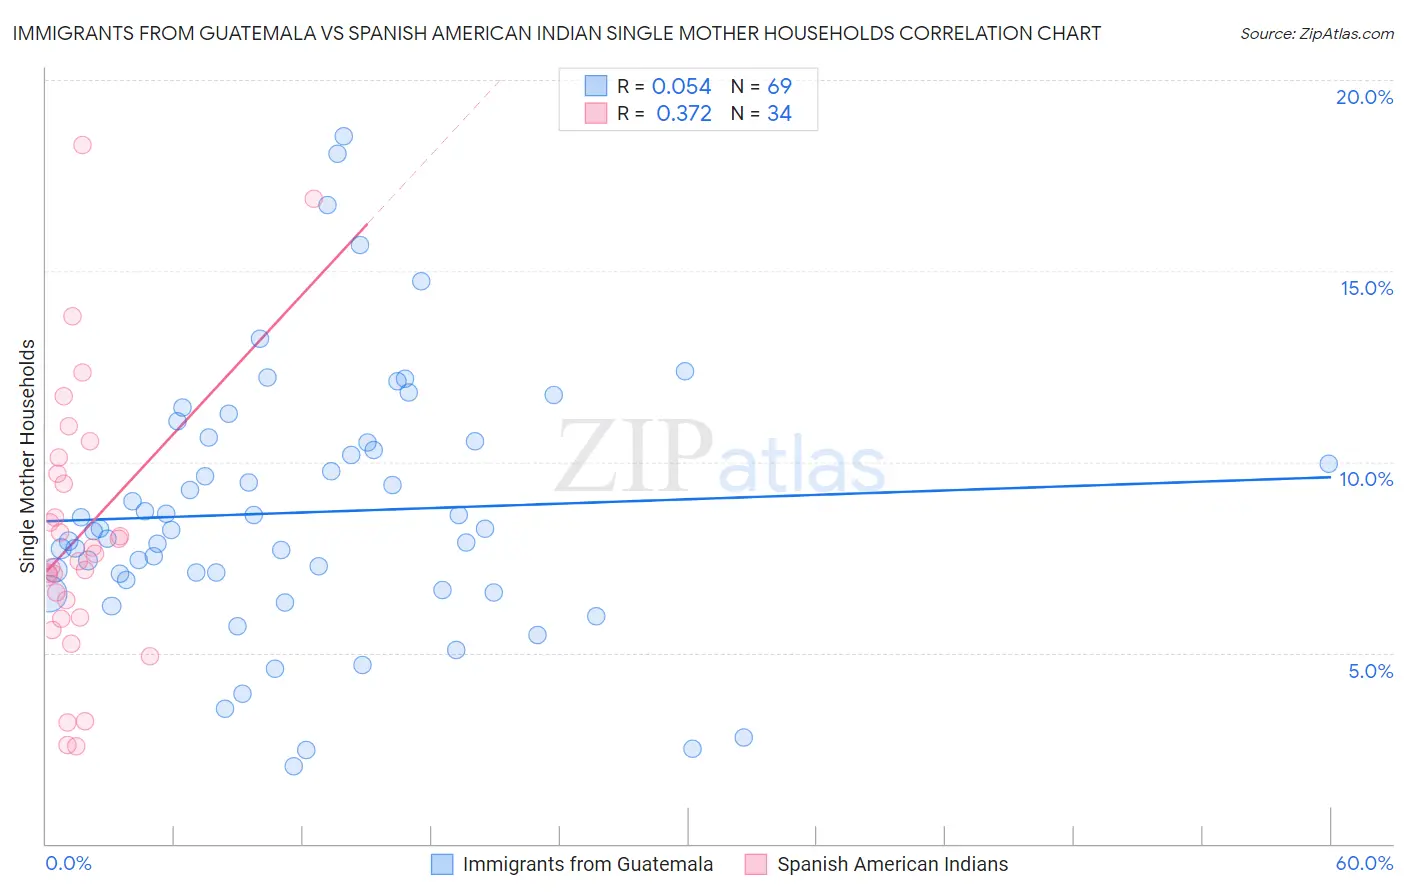
Immigrants from Guatemala vs Spanish American Indian Single Mother Households Correlation Chart
The statistical analysis conducted on geographies consisting of 376,787,729 people shows a slight positive correlation between the proportion of Immigrants from Guatemala and percentage of single mother households in the United States with a correlation coefficient (R) of 0.054 and weighted average of 7.7%. Similarly, the statistical analysis conducted on geographies consisting of 73,133,318 people shows a mild positive correlation between the proportion of Spanish American Indians and percentage of single mother households in the United States with a correlation coefficient (R) of 0.372 and weighted average of 7.3%, a difference of 6.5%.
Single Mother Households Correlation Summary
| Measurement | Immigrants from Guatemala | Spanish American Indian |
| Minimum | 2.0% | 2.6% |
| Maximum | 18.5% | 18.3% |
| Range | 16.5% | 15.7% |
| Mean | 8.7% | 8.1% |
| Median | 8.2% | 7.5% |
| Interquartile 25% (IQ1) | 6.8% | 5.9% |
| Interquartile 75% (IQ3) | 10.5% | 9.7% |
| Interquartile Range (IQR) | 3.7% | 3.8% |
| Standard Deviation (Sample) | 3.4% | 3.6% |
| Standard Deviation (Population) | 3.4% | 3.5% |
Similar Demographics by Single Mother Households
Demographics Similar to Immigrants from Guatemala by Single Mother Households
In terms of single mother households, the demographic groups most similar to Immigrants from Guatemala are Sierra Leonean (7.7%, a difference of 0.050%), Immigrants from Middle Africa (7.7%, a difference of 0.10%), Trinidadian and Tobagonian (7.7%, a difference of 0.21%), Immigrants from Belize (7.7%, a difference of 0.24%), and Nigerian (7.7%, a difference of 0.84%).
| Demographics | Rating | Rank | Single Mother Households |
| Immigrants | Sierra Leone | 0.0 /100 | #280 | Tragic 7.7% |
| Immigrants | Laos | 0.0 /100 | #281 | Tragic 7.7% |
| Guatemalans | 0.0 /100 | #282 | Tragic 7.7% |
| Nigerians | 0.0 /100 | #283 | Tragic 7.7% |
| Immigrants | Belize | 0.0 /100 | #284 | Tragic 7.7% |
| Trinidadians and Tobagonians | 0.0 /100 | #285 | Tragic 7.7% |
| Immigrants | Middle Africa | 0.0 /100 | #286 | Tragic 7.7% |
| Immigrants | Guatemala | 0.0 /100 | #287 | Tragic 7.7% |
| Sierra Leoneans | 0.0 /100 | #288 | Tragic 7.7% |
| Sub-Saharan Africans | 0.0 /100 | #289 | Tragic 7.8% |
| Immigrants | Nigeria | 0.0 /100 | #290 | Tragic 7.8% |
| West Indians | 0.0 /100 | #291 | Tragic 7.8% |
| Ghanaians | 0.0 /100 | #292 | Tragic 7.8% |
| Immigrants | Cameroon | 0.0 /100 | #293 | Tragic 7.9% |
| Apache | 0.0 /100 | #294 | Tragic 7.9% |
Demographics Similar to Spanish American Indians by Single Mother Households
In terms of single mother households, the demographic groups most similar to Spanish American Indians are Dutch West Indian (7.3%, a difference of 0.030%), Nicaraguan (7.2%, a difference of 0.28%), Bermudan (7.3%, a difference of 0.29%), Immigrants from Africa (7.3%, a difference of 0.30%), and Immigrants from Cambodia (7.2%, a difference of 0.46%).
| Demographics | Rating | Rank | Single Mother Households |
| Immigrants | Portugal | 0.6 /100 | #241 | Tragic 7.2% |
| Fijians | 0.6 /100 | #242 | Tragic 7.2% |
| Ecuadorians | 0.6 /100 | #243 | Tragic 7.2% |
| Cubans | 0.6 /100 | #244 | Tragic 7.2% |
| Immigrants | Cambodia | 0.5 /100 | #245 | Tragic 7.2% |
| Nicaraguans | 0.5 /100 | #246 | Tragic 7.2% |
| Dutch West Indians | 0.4 /100 | #247 | Tragic 7.3% |
| Spanish American Indians | 0.4 /100 | #248 | Tragic 7.3% |
| Bermudans | 0.4 /100 | #249 | Tragic 7.3% |
| Immigrants | Africa | 0.4 /100 | #250 | Tragic 7.3% |
| Malaysians | 0.3 /100 | #251 | Tragic 7.3% |
| Alaskan Athabascans | 0.3 /100 | #252 | Tragic 7.3% |
| Cajuns | 0.3 /100 | #253 | Tragic 7.3% |
| Immigrants | Ecuador | 0.3 /100 | #254 | Tragic 7.3% |
| Mexican American Indians | 0.2 /100 | #255 | Tragic 7.4% |