Immigrants from Guatemala vs Blackfeet Single Mother Households
COMPARE
Immigrants from Guatemala
Blackfeet
Single Mother Households
Single Mother Households Comparison
Immigrants from Guatemala
Blackfeet
7.7%
SINGLE MOTHER HOUSEHOLDS
0.0/ 100
METRIC RATING
287th/ 347
METRIC RANK
7.5%
SINGLE MOTHER HOUSEHOLDS
0.1/ 100
METRIC RATING
267th/ 347
METRIC RANK
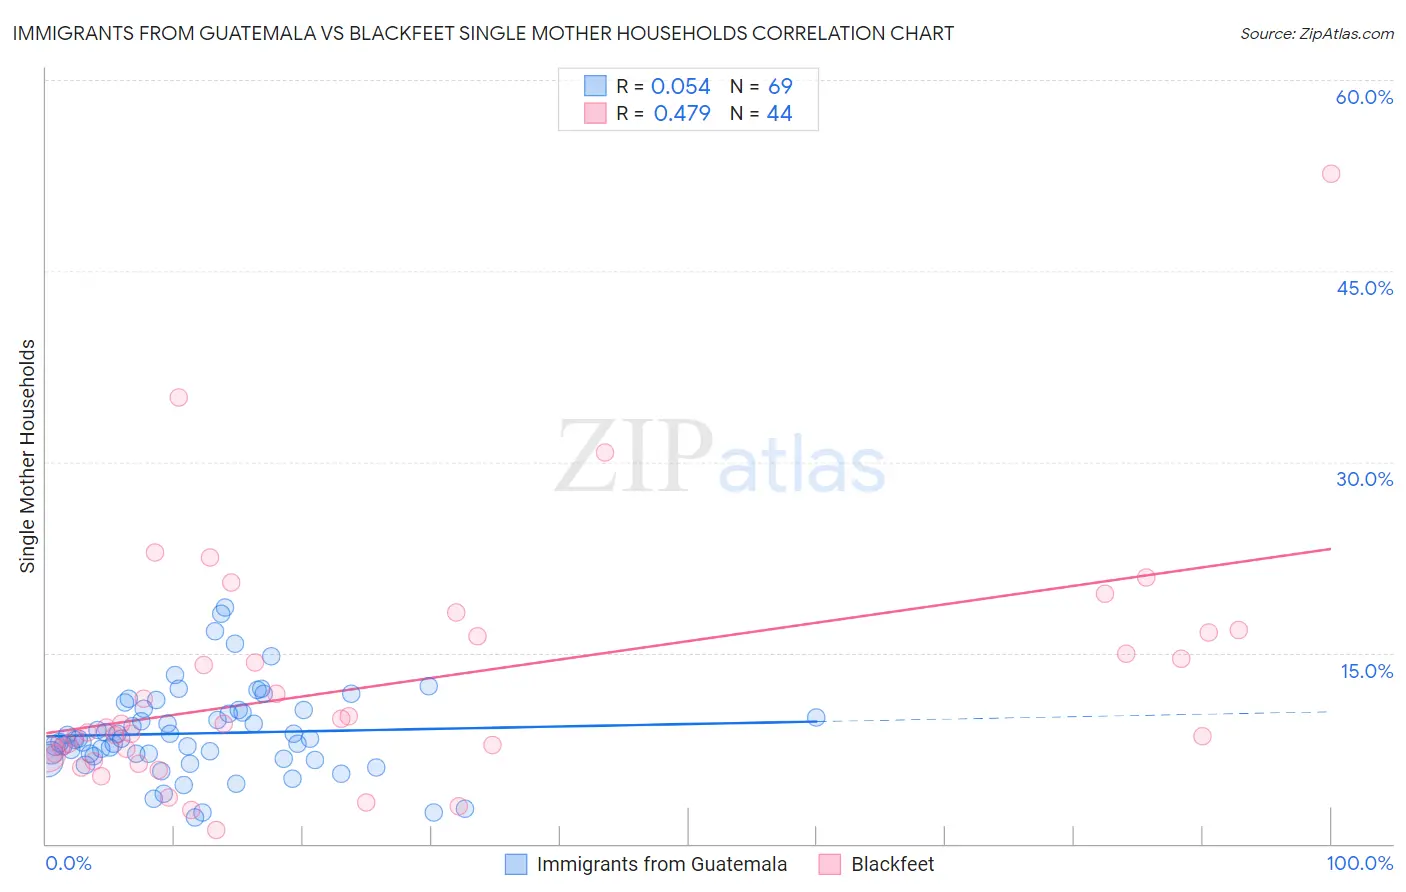
Immigrants from Guatemala vs Blackfeet Single Mother Households Correlation Chart
The statistical analysis conducted on geographies consisting of 376,787,729 people shows a slight positive correlation between the proportion of Immigrants from Guatemala and percentage of single mother households in the United States with a correlation coefficient (R) of 0.054 and weighted average of 7.7%. Similarly, the statistical analysis conducted on geographies consisting of 309,066,694 people shows a moderate positive correlation between the proportion of Blackfeet and percentage of single mother households in the United States with a correlation coefficient (R) of 0.479 and weighted average of 7.5%, a difference of 3.3%.
Single Mother Households Correlation Summary
| Measurement | Immigrants from Guatemala | Blackfeet |
| Minimum | 2.0% | 1.1% |
| Maximum | 18.5% | 52.6% |
| Range | 16.5% | 51.5% |
| Mean | 8.7% | 12.5% |
| Median | 8.2% | 9.2% |
| Interquartile 25% (IQ1) | 6.8% | 7.1% |
| Interquartile 75% (IQ3) | 10.5% | 16.4% |
| Interquartile Range (IQR) | 3.7% | 9.3% |
| Standard Deviation (Sample) | 3.4% | 9.5% |
| Standard Deviation (Population) | 3.4% | 9.4% |
Demographics Similar to Immigrants from Guatemala and Blackfeet by Single Mother Households
In terms of single mother households, the demographic groups most similar to Immigrants from Guatemala are Immigrants from Middle Africa (7.7%, a difference of 0.10%), Trinidadian and Tobagonian (7.7%, a difference of 0.21%), Immigrants from Belize (7.7%, a difference of 0.24%), Nigerian (7.7%, a difference of 0.84%), and Guatemalan (7.7%, a difference of 0.87%). Similarly, the demographic groups most similar to Blackfeet are Indonesian (7.5%, a difference of 0.040%), Somali (7.5%, a difference of 0.45%), Immigrants from Cuba (7.5%, a difference of 0.62%), Salvadoran (7.5%, a difference of 0.71%), and Immigrants from the Azores (7.5%, a difference of 0.71%).
| Demographics | Rating | Rank | Single Mother Households |
| Blackfeet | 0.1 /100 | #267 | Tragic 7.5% |
| Indonesians | 0.1 /100 | #268 | Tragic 7.5% |
| Somalis | 0.1 /100 | #269 | Tragic 7.5% |
| Immigrants | Cuba | 0.1 /100 | #270 | Tragic 7.5% |
| Salvadorans | 0.1 /100 | #271 | Tragic 7.5% |
| Immigrants | Azores | 0.1 /100 | #272 | Tragic 7.5% |
| Belizeans | 0.1 /100 | #273 | Tragic 7.6% |
| Immigrants | Guyana | 0.1 /100 | #274 | Tragic 7.6% |
| Central American Indians | 0.1 /100 | #275 | Tragic 7.6% |
| Guyanese | 0.1 /100 | #276 | Tragic 7.6% |
| Immigrants | Trinidad and Tobago | 0.1 /100 | #277 | Tragic 7.6% |
| Central Americans | 0.1 /100 | #278 | Tragic 7.6% |
| Immigrants | El Salvador | 0.0 /100 | #279 | Tragic 7.6% |
| Immigrants | Sierra Leone | 0.0 /100 | #280 | Tragic 7.7% |
| Immigrants | Laos | 0.0 /100 | #281 | Tragic 7.7% |
| Guatemalans | 0.0 /100 | #282 | Tragic 7.7% |
| Nigerians | 0.0 /100 | #283 | Tragic 7.7% |
| Immigrants | Belize | 0.0 /100 | #284 | Tragic 7.7% |
| Trinidadians and Tobagonians | 0.0 /100 | #285 | Tragic 7.7% |
| Immigrants | Middle Africa | 0.0 /100 | #286 | Tragic 7.7% |
| Immigrants | Guatemala | 0.0 /100 | #287 | Tragic 7.7% |