Immigrants from West Indies vs Immigrants from England Family Households with Children
COMPARE
Immigrants from West Indies
Immigrants from England
Family Households with Children
Family Households with Children Comparison
Immigrants from West Indies
Immigrants from England
25.7%
FAMILY HOUSEHOLDS WITH CHILDREN
0.0/ 100
METRIC RATING
336th/ 347
METRIC RANK
26.9%
FAMILY HOUSEHOLDS WITH CHILDREN
3.2/ 100
METRIC RATING
242nd/ 347
METRIC RANK
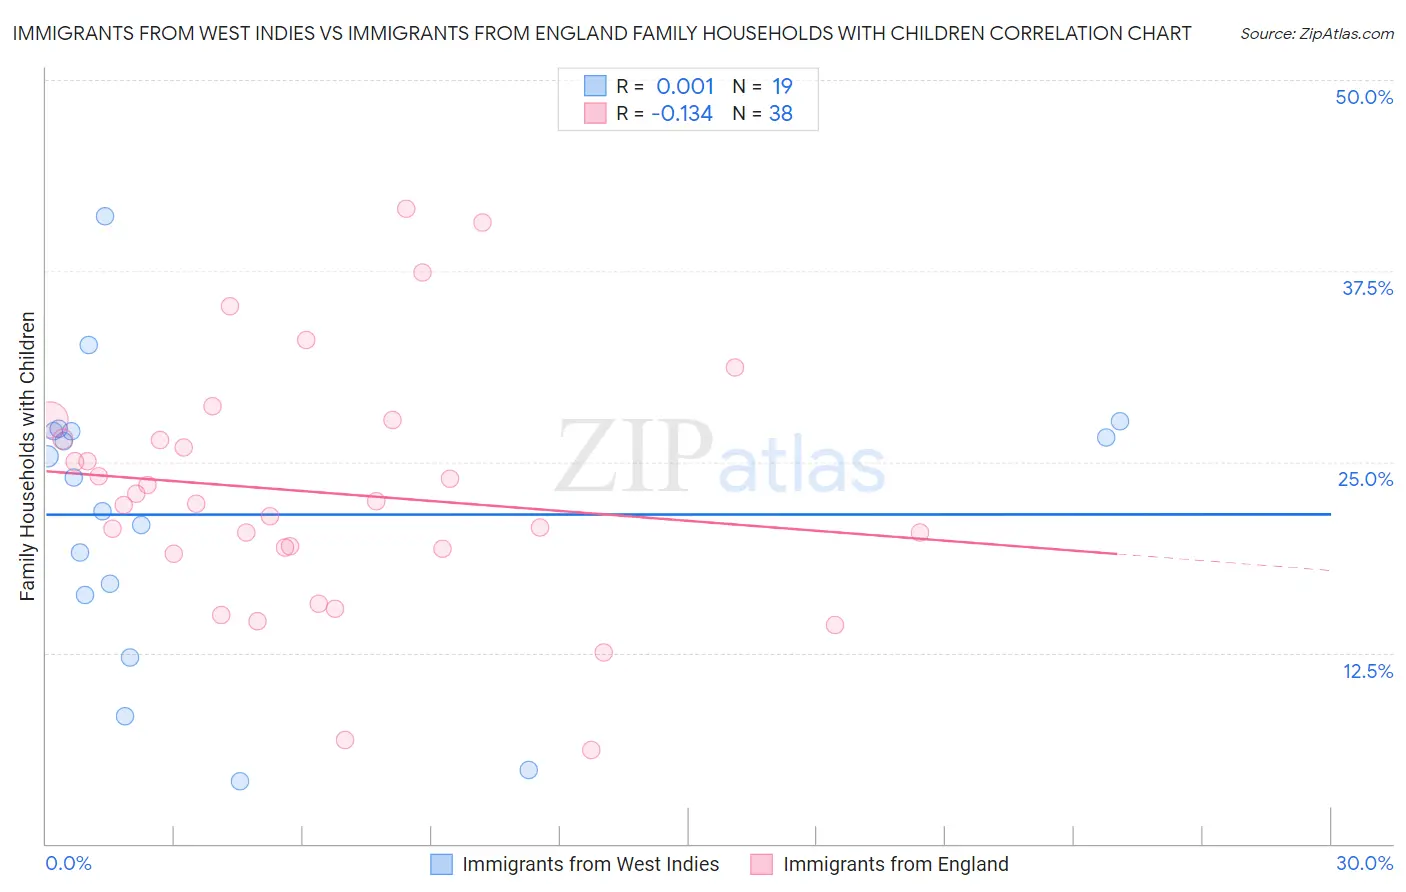
Immigrants from West Indies vs Immigrants from England Family Households with Children Correlation Chart
The statistical analysis conducted on geographies consisting of 72,454,628 people shows no correlation between the proportion of Immigrants from West Indies and percentage of family households with children in the United States with a correlation coefficient (R) of 0.001 and weighted average of 25.7%. Similarly, the statistical analysis conducted on geographies consisting of 391,583,092 people shows a poor negative correlation between the proportion of Immigrants from England and percentage of family households with children in the United States with a correlation coefficient (R) of -0.134 and weighted average of 26.9%, a difference of 4.9%.
Family Households with Children Correlation Summary
| Measurement | Immigrants from West Indies | Immigrants from England |
| Minimum | 4.1% | 6.1% |
| Maximum | 41.1% | 41.6% |
| Range | 37.0% | 35.4% |
| Mean | 21.5% | 23.0% |
| Median | 24.0% | 22.3% |
| Interquartile 25% (IQ1) | 16.3% | 19.3% |
| Interquartile 75% (IQ3) | 27.0% | 26.5% |
| Interquartile Range (IQR) | 10.8% | 7.2% |
| Standard Deviation (Sample) | 9.4% | 8.0% |
| Standard Deviation (Population) | 9.2% | 7.9% |
Similar Demographics by Family Households with Children
Demographics Similar to Immigrants from West Indies by Family Households with Children
In terms of family households with children, the demographic groups most similar to Immigrants from West Indies are Immigrants from Croatia (25.7%, a difference of 0.10%), Slovak (25.7%, a difference of 0.11%), Immigrants from Switzerland (25.7%, a difference of 0.26%), Immigrants from Austria (25.8%, a difference of 0.34%), and Puerto Rican (25.6%, a difference of 0.39%).
| Demographics | Rating | Rank | Family Households with Children |
| Cypriots | 0.0 /100 | #329 | Tragic 25.9% |
| Immigrants | Latvia | 0.0 /100 | #330 | Tragic 25.9% |
| Slovenes | 0.0 /100 | #331 | Tragic 25.8% |
| Immigrants | Austria | 0.0 /100 | #332 | Tragic 25.8% |
| Immigrants | Switzerland | 0.0 /100 | #333 | Tragic 25.7% |
| Slovaks | 0.0 /100 | #334 | Tragic 25.7% |
| Immigrants | Croatia | 0.0 /100 | #335 | Tragic 25.7% |
| Immigrants | West Indies | 0.0 /100 | #336 | Tragic 25.7% |
| Puerto Ricans | 0.0 /100 | #337 | Tragic 25.6% |
| Arapaho | 0.0 /100 | #338 | Tragic 25.6% |
| Immigrants | St. Vincent and the Grenadines | 0.0 /100 | #339 | Tragic 25.6% |
| Immigrants | Armenia | 0.0 /100 | #340 | Tragic 25.6% |
| Immigrants | Serbia | 0.0 /100 | #341 | Tragic 25.5% |
| Alsatians | 0.0 /100 | #342 | Tragic 25.3% |
| Hopi | 0.0 /100 | #343 | Tragic 25.2% |
Demographics Similar to Immigrants from England by Family Households with Children
In terms of family households with children, the demographic groups most similar to Immigrants from England are Navajo (26.9%, a difference of 0.0%), Immigrants from Bulgaria (26.9%, a difference of 0.010%), Moroccan (26.9%, a difference of 0.030%), Immigrants from Southern Europe (26.9%, a difference of 0.030%), and Immigrants from Netherlands (26.9%, a difference of 0.040%).
| Demographics | Rating | Rank | Family Households with Children |
| Immigrants | Morocco | 4.2 /100 | #235 | Tragic 27.0% |
| Cape Verdeans | 3.6 /100 | #236 | Tragic 26.9% |
| Immigrants | Netherlands | 3.5 /100 | #237 | Tragic 26.9% |
| Moroccans | 3.4 /100 | #238 | Tragic 26.9% |
| Immigrants | Southern Europe | 3.4 /100 | #239 | Tragic 26.9% |
| Immigrants | Bulgaria | 3.3 /100 | #240 | Tragic 26.9% |
| Navajo | 3.2 /100 | #241 | Tragic 26.9% |
| Immigrants | England | 3.2 /100 | #242 | Tragic 26.9% |
| Immigrants | Saudi Arabia | 2.9 /100 | #243 | Tragic 26.9% |
| Ukrainians | 2.9 /100 | #244 | Tragic 26.9% |
| Australians | 2.8 /100 | #245 | Tragic 26.9% |
| Jamaicans | 2.5 /100 | #246 | Tragic 26.9% |
| Potawatomi | 2.2 /100 | #247 | Tragic 26.9% |
| Immigrants | Kazakhstan | 2.2 /100 | #248 | Tragic 26.9% |
| Immigrants | Eastern Europe | 2.1 /100 | #249 | Tragic 26.9% |