Immigrants from Ghana vs Immigrants from Costa Rica Births to Unmarried Women
COMPARE
Immigrants from Ghana
Immigrants from Costa Rica
Births to Unmarried Women
Births to Unmarried Women Comparison
Immigrants from Ghana
Immigrants from Costa Rica
34.5%
BIRTHS TO UNMARRIED WOMEN
2.2/ 100
METRIC RATING
235th/ 347
METRIC RANK
33.4%
BIRTHS TO UNMARRIED WOMEN
9.5/ 100
METRIC RATING
213th/ 347
METRIC RANK
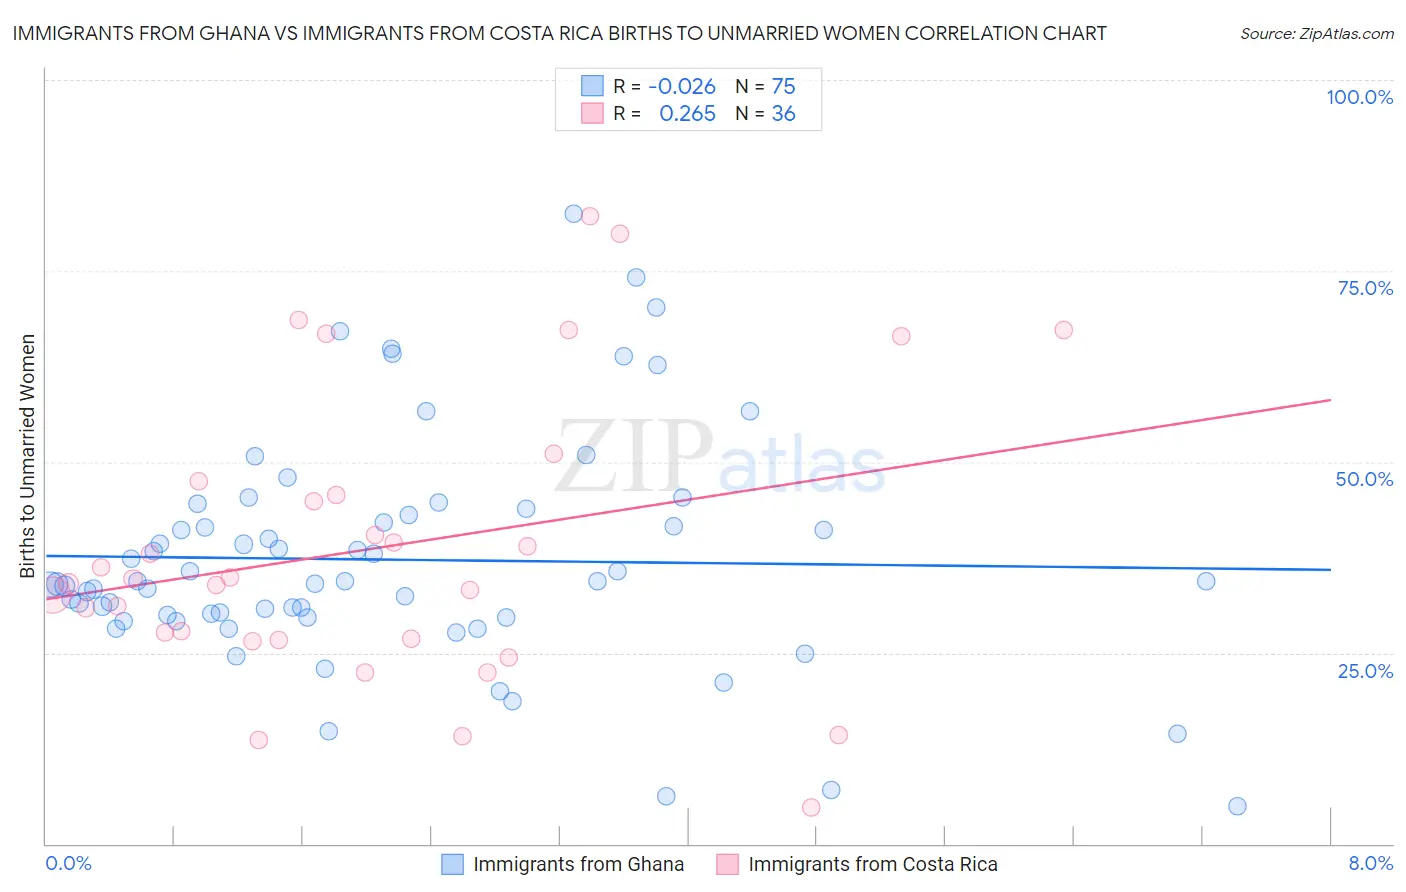
Immigrants from Ghana vs Immigrants from Costa Rica Births to Unmarried Women Correlation Chart
The statistical analysis conducted on geographies consisting of 193,200,856 people shows no correlation between the proportion of Immigrants from Ghana and percentage of births to unmarried women in the United States with a correlation coefficient (R) of -0.026 and weighted average of 34.5%. Similarly, the statistical analysis conducted on geographies consisting of 197,576,529 people shows a weak positive correlation between the proportion of Immigrants from Costa Rica and percentage of births to unmarried women in the United States with a correlation coefficient (R) of 0.265 and weighted average of 33.4%, a difference of 3.5%.
Births to Unmarried Women Correlation Summary
| Measurement | Immigrants from Ghana | Immigrants from Costa Rica |
| Minimum | 4.9% | 4.8% |
| Maximum | 82.5% | 82.2% |
| Range | 77.6% | 77.4% |
| Mean | 37.2% | 38.8% |
| Median | 34.4% | 34.4% |
| Interquartile 25% (IQ1) | 29.7% | 26.8% |
| Interquartile 75% (IQ3) | 43.0% | 46.6% |
| Interquartile Range (IQR) | 13.3% | 19.8% |
| Standard Deviation (Sample) | 14.9% | 19.0% |
| Standard Deviation (Population) | 14.8% | 18.7% |
Similar Demographics by Births to Unmarried Women
Demographics Similar to Immigrants from Ghana by Births to Unmarried Women
In terms of births to unmarried women, the demographic groups most similar to Immigrants from Ghana are Immigrants from Zaire (34.5%, a difference of 0.070%), Bangladeshi (34.4%, a difference of 0.31%), French Canadian (34.4%, a difference of 0.33%), Native Hawaiian (34.3%, a difference of 0.62%), and Immigrants from Cameroon (34.7%, a difference of 0.63%).
| Demographics | Rating | Rank | Births to Unmarried Women |
| Panamanians | 3.3 /100 | #228 | Tragic 34.2% |
| Immigrants | Sierra Leone | 3.1 /100 | #229 | Tragic 34.2% |
| Ghanaians | 3.1 /100 | #230 | Tragic 34.3% |
| Native Hawaiians | 2.9 /100 | #231 | Tragic 34.3% |
| French Canadians | 2.5 /100 | #232 | Tragic 34.4% |
| Bangladeshis | 2.5 /100 | #233 | Tragic 34.4% |
| Immigrants | Zaire | 2.3 /100 | #234 | Tragic 34.5% |
| Immigrants | Ghana | 2.2 /100 | #235 | Tragic 34.5% |
| Immigrants | Cameroon | 1.6 /100 | #236 | Tragic 34.7% |
| Marshallese | 1.6 /100 | #237 | Tragic 34.8% |
| Immigrants | Cambodia | 1.6 /100 | #238 | Tragic 34.8% |
| Sierra Leoneans | 1.4 /100 | #239 | Tragic 34.9% |
| Immigrants | Middle Africa | 1.2 /100 | #240 | Tragic 34.9% |
| Immigrants | Guyana | 1.2 /100 | #241 | Tragic 35.0% |
| Indonesians | 1.2 /100 | #242 | Tragic 35.0% |
Demographics Similar to Immigrants from Costa Rica by Births to Unmarried Women
In terms of births to unmarried women, the demographic groups most similar to Immigrants from Costa Rica are Slovak (33.4%, a difference of 0.050%), Celtic (33.3%, a difference of 0.19%), French (33.4%, a difference of 0.22%), Ecuadorian (33.3%, a difference of 0.26%), and White/Caucasian (33.3%, a difference of 0.31%).
| Demographics | Rating | Rank | Births to Unmarried Women |
| Uruguayans | 12.8 /100 | #206 | Poor 33.1% |
| Immigrants | Sudan | 11.5 /100 | #207 | Poor 33.2% |
| Hawaiians | 11.3 /100 | #208 | Poor 33.2% |
| Whites/Caucasians | 10.7 /100 | #209 | Poor 33.3% |
| Scotch-Irish | 10.7 /100 | #210 | Poor 33.3% |
| Ecuadorians | 10.5 /100 | #211 | Poor 33.3% |
| Celtics | 10.2 /100 | #212 | Poor 33.3% |
| Immigrants | Costa Rica | 9.5 /100 | #213 | Tragic 33.4% |
| Slovaks | 9.3 /100 | #214 | Tragic 33.4% |
| French | 8.7 /100 | #215 | Tragic 33.4% |
| Nepalese | 7.8 /100 | #216 | Tragic 33.5% |
| Spaniards | 7.0 /100 | #217 | Tragic 33.6% |
| Immigrants | Ecuador | 5.9 /100 | #218 | Tragic 33.7% |
| Alsatians | 5.4 /100 | #219 | Tragic 33.8% |
| Portuguese | 5.4 /100 | #220 | Tragic 33.8% |