Immigrants from Ghana vs Pakistani Births to Unmarried Women
COMPARE
Immigrants from Ghana
Pakistani
Births to Unmarried Women
Births to Unmarried Women Comparison
Immigrants from Ghana
Pakistanis
34.5%
BIRTHS TO UNMARRIED WOMEN
2.2/ 100
METRIC RATING
235th/ 347
METRIC RANK
30.5%
BIRTHS TO UNMARRIED WOMEN
83.0/ 100
METRIC RATING
141st/ 347
METRIC RANK
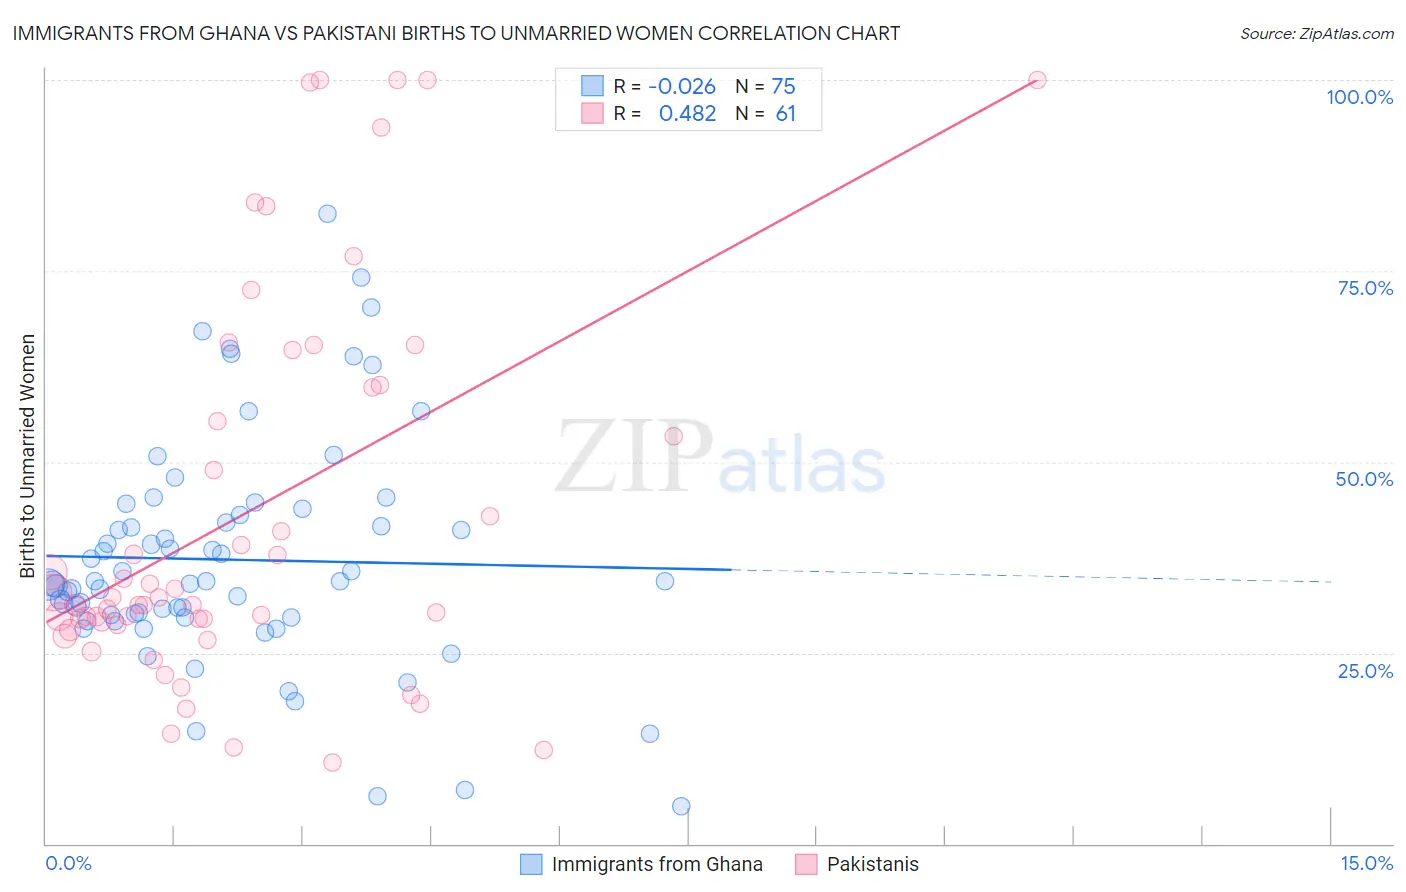
Immigrants from Ghana vs Pakistani Births to Unmarried Women Correlation Chart
The statistical analysis conducted on geographies consisting of 193,200,856 people shows no correlation between the proportion of Immigrants from Ghana and percentage of births to unmarried women in the United States with a correlation coefficient (R) of -0.026 and weighted average of 34.5%. Similarly, the statistical analysis conducted on geographies consisting of 317,371,382 people shows a moderate positive correlation between the proportion of Pakistanis and percentage of births to unmarried women in the United States with a correlation coefficient (R) of 0.482 and weighted average of 30.5%, a difference of 13.2%.
Births to Unmarried Women Correlation Summary
| Measurement | Immigrants from Ghana | Pakistani |
| Minimum | 4.9% | 10.7% |
| Maximum | 82.5% | 100.0% |
| Range | 77.6% | 89.3% |
| Mean | 37.2% | 43.3% |
| Median | 34.4% | 32.2% |
| Interquartile 25% (IQ1) | 29.7% | 28.9% |
| Interquartile 75% (IQ3) | 43.0% | 59.8% |
| Interquartile Range (IQR) | 13.3% | 31.0% |
| Standard Deviation (Sample) | 14.9% | 25.2% |
| Standard Deviation (Population) | 14.8% | 25.0% |
Similar Demographics by Births to Unmarried Women
Demographics Similar to Immigrants from Ghana by Births to Unmarried Women
In terms of births to unmarried women, the demographic groups most similar to Immigrants from Ghana are Immigrants from Zaire (34.5%, a difference of 0.070%), Bangladeshi (34.4%, a difference of 0.31%), French Canadian (34.4%, a difference of 0.33%), Native Hawaiian (34.3%, a difference of 0.62%), and Immigrants from Cameroon (34.7%, a difference of 0.63%).
| Demographics | Rating | Rank | Births to Unmarried Women |
| Panamanians | 3.3 /100 | #228 | Tragic 34.2% |
| Immigrants | Sierra Leone | 3.1 /100 | #229 | Tragic 34.2% |
| Ghanaians | 3.1 /100 | #230 | Tragic 34.3% |
| Native Hawaiians | 2.9 /100 | #231 | Tragic 34.3% |
| French Canadians | 2.5 /100 | #232 | Tragic 34.4% |
| Bangladeshis | 2.5 /100 | #233 | Tragic 34.4% |
| Immigrants | Zaire | 2.3 /100 | #234 | Tragic 34.5% |
| Immigrants | Ghana | 2.2 /100 | #235 | Tragic 34.5% |
| Immigrants | Cameroon | 1.6 /100 | #236 | Tragic 34.7% |
| Marshallese | 1.6 /100 | #237 | Tragic 34.8% |
| Immigrants | Cambodia | 1.6 /100 | #238 | Tragic 34.8% |
| Sierra Leoneans | 1.4 /100 | #239 | Tragic 34.9% |
| Immigrants | Middle Africa | 1.2 /100 | #240 | Tragic 34.9% |
| Immigrants | Guyana | 1.2 /100 | #241 | Tragic 35.0% |
| Indonesians | 1.2 /100 | #242 | Tragic 35.0% |
Demographics Similar to Pakistanis by Births to Unmarried Women
In terms of births to unmarried women, the demographic groups most similar to Pakistanis are Swiss (30.5%, a difference of 0.020%), South African (30.5%, a difference of 0.060%), Immigrants from Uganda (30.5%, a difference of 0.080%), Immigrants from Canada (30.4%, a difference of 0.13%), and Czech (30.5%, a difference of 0.15%).
| Demographics | Rating | Rank | Births to Unmarried Women |
| Immigrants | South Eastern Asia | 85.2 /100 | #134 | Excellent 30.4% |
| Brazilians | 84.8 /100 | #135 | Excellent 30.4% |
| Immigrants | Scotland | 84.6 /100 | #136 | Excellent 30.4% |
| Immigrants | Philippines | 83.9 /100 | #137 | Excellent 30.4% |
| Puget Sound Salish | 83.9 /100 | #138 | Excellent 30.4% |
| Immigrants | Canada | 83.7 /100 | #139 | Excellent 30.4% |
| Swiss | 83.1 /100 | #140 | Excellent 30.5% |
| Pakistanis | 83.0 /100 | #141 | Excellent 30.5% |
| South Africans | 82.7 /100 | #142 | Excellent 30.5% |
| Immigrants | Uganda | 82.6 /100 | #143 | Excellent 30.5% |
| Czechs | 82.1 /100 | #144 | Excellent 30.5% |
| Immigrants | North America | 81.5 /100 | #145 | Excellent 30.6% |
| Northern Europeans | 81.4 /100 | #146 | Excellent 30.6% |
| Immigrants | Oceania | 81.2 /100 | #147 | Excellent 30.6% |
| Chileans | 79.1 /100 | #148 | Good 30.7% |