Immigrants from France vs Thai Family Households with Children
COMPARE
Immigrants from France
Thai
Family Households with Children
Family Households with Children Comparison
Immigrants from France
Thais
26.0%
FAMILY HOUSEHOLDS WITH CHILDREN
0.0/ 100
METRIC RATING
319th/ 347
METRIC RANK
30.6%
FAMILY HOUSEHOLDS WITH CHILDREN
100.0/ 100
METRIC RATING
9th/ 347
METRIC RANK
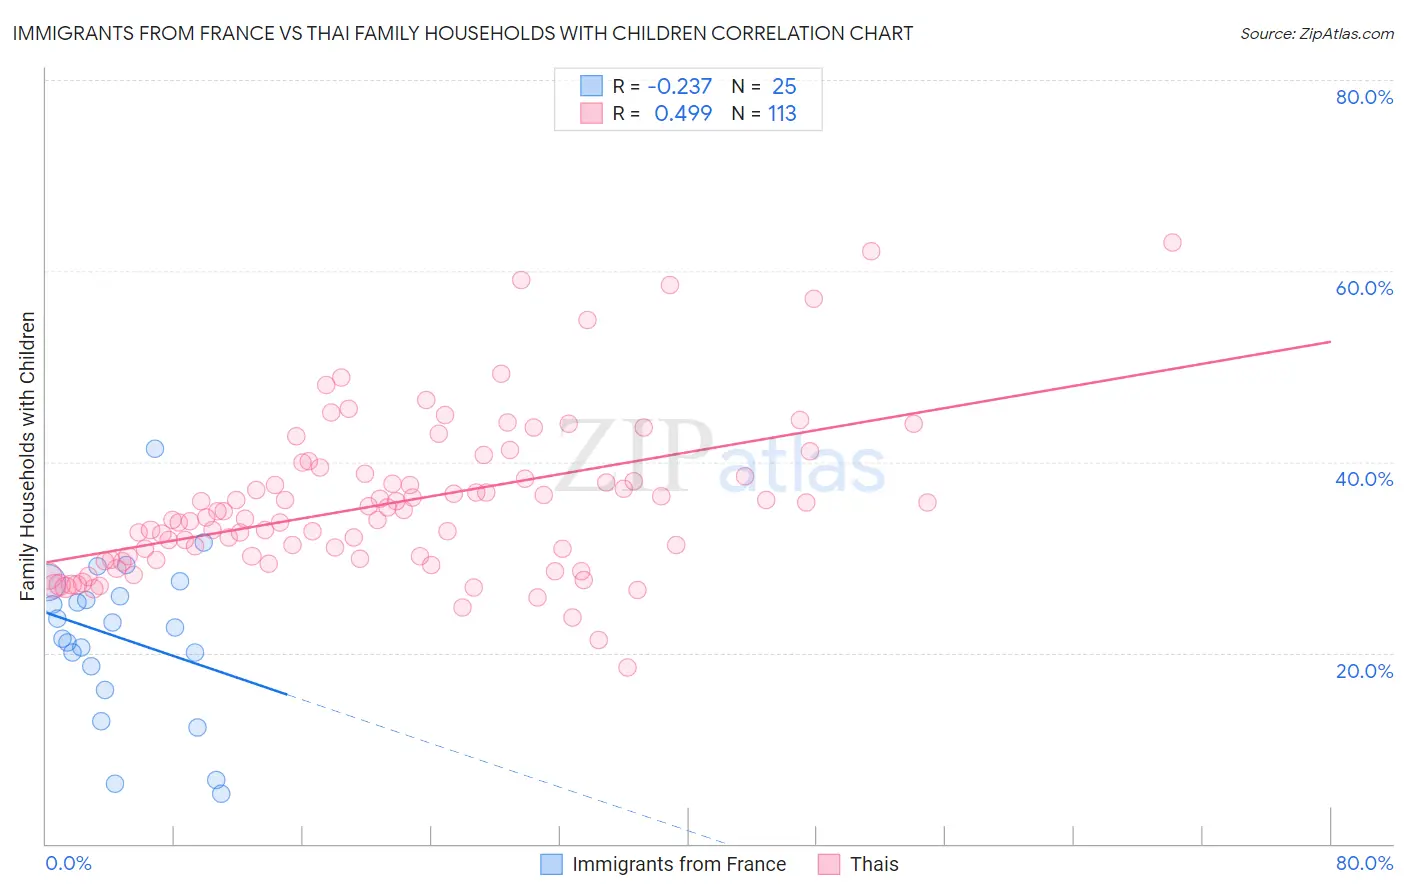
Immigrants from France vs Thai Family Households with Children Correlation Chart
The statistical analysis conducted on geographies consisting of 287,768,662 people shows a weak negative correlation between the proportion of Immigrants from France and percentage of family households with children in the United States with a correlation coefficient (R) of -0.237 and weighted average of 26.0%. Similarly, the statistical analysis conducted on geographies consisting of 475,181,925 people shows a moderate positive correlation between the proportion of Thais and percentage of family households with children in the United States with a correlation coefficient (R) of 0.499 and weighted average of 30.6%, a difference of 17.7%.
Family Households with Children Correlation Summary
| Measurement | Immigrants from France | Thai |
| Minimum | 5.3% | 18.5% |
| Maximum | 41.4% | 63.0% |
| Range | 36.2% | 44.5% |
| Mean | 21.5% | 35.6% |
| Median | 22.7% | 34.1% |
| Interquartile 25% (IQ1) | 17.3% | 29.8% |
| Interquartile 75% (IQ3) | 26.7% | 38.6% |
| Interquartile Range (IQR) | 9.3% | 8.8% |
| Standard Deviation (Sample) | 8.4% | 8.2% |
| Standard Deviation (Population) | 8.2% | 8.2% |
Similar Demographics by Family Households with Children
Demographics Similar to Immigrants from France by Family Households with Children
In terms of family households with children, the demographic groups most similar to Immigrants from France are Tlingit-Haida (26.0%, a difference of 0.020%), British West Indian (26.0%, a difference of 0.030%), Immigrants from Greece (26.0%, a difference of 0.040%), Immigrants from Australia (26.0%, a difference of 0.070%), and Iroquois (26.1%, a difference of 0.090%).
| Demographics | Rating | Rank | Family Households with Children |
| Immigrants | Czechoslovakia | 0.0 /100 | #312 | Tragic 26.2% |
| Cree | 0.0 /100 | #313 | Tragic 26.2% |
| French Canadians | 0.0 /100 | #314 | Tragic 26.1% |
| Immigrants | Norway | 0.0 /100 | #315 | Tragic 26.1% |
| Estonians | 0.0 /100 | #316 | Tragic 26.1% |
| Ottawa | 0.0 /100 | #317 | Tragic 26.1% |
| Iroquois | 0.0 /100 | #318 | Tragic 26.1% |
| Immigrants | France | 0.0 /100 | #319 | Tragic 26.0% |
| Tlingit-Haida | 0.0 /100 | #320 | Tragic 26.0% |
| British West Indians | 0.0 /100 | #321 | Tragic 26.0% |
| Immigrants | Greece | 0.0 /100 | #322 | Tragic 26.0% |
| Immigrants | Australia | 0.0 /100 | #323 | Tragic 26.0% |
| Chinese | 0.0 /100 | #324 | Tragic 26.0% |
| Barbadians | 0.0 /100 | #325 | Tragic 26.0% |
| Immigrants | Ireland | 0.0 /100 | #326 | Tragic 26.0% |
Demographics Similar to Thais by Family Households with Children
In terms of family households with children, the demographic groups most similar to Thais are Immigrants from Fiji (30.5%, a difference of 0.32%), Nepalese (30.5%, a difference of 0.40%), Yakama (30.8%, a difference of 0.48%), Immigrants from Central America (31.0%, a difference of 1.1%), and Immigrants from Pakistan (30.2%, a difference of 1.3%).
| Demographics | Rating | Rank | Family Households with Children |
| Inupiat | 100 /100 | #2 | Exceptional 32.8% |
| Immigrants | Mexico | 100.0 /100 | #3 | Exceptional 31.6% |
| Mexicans | 100.0 /100 | #4 | Exceptional 31.4% |
| Tongans | 100.0 /100 | #5 | Exceptional 31.2% |
| Immigrants | India | 100.0 /100 | #6 | Exceptional 31.0% |
| Immigrants | Central America | 100.0 /100 | #7 | Exceptional 31.0% |
| Yakama | 100.0 /100 | #8 | Exceptional 30.8% |
| Thais | 100.0 /100 | #9 | Exceptional 30.6% |
| Immigrants | Fiji | 100.0 /100 | #10 | Exceptional 30.5% |
| Nepalese | 100.0 /100 | #11 | Exceptional 30.5% |
| Immigrants | Pakistan | 100.0 /100 | #12 | Exceptional 30.2% |
| Afghans | 100.0 /100 | #13 | Exceptional 30.2% |
| Bangladeshis | 100.0 /100 | #14 | Exceptional 30.1% |
| Immigrants | South Central Asia | 100.0 /100 | #15 | Exceptional 30.0% |
| Immigrants | Afghanistan | 100.0 /100 | #16 | Exceptional 30.0% |