Immigrants from Fiji vs Immigrants from St. Vincent and the Grenadines Divorced or Separated

COMPARE

Immigrants from Fiji
Race
Ancestry
AfghanAfricanAlaska NativeAlaskan AthabascanAlbanianAleutAlsatianAmericanApacheArabArapahoArgentineanArmenianAssyrian/Chaldean/SyriacAustralianAustrianBahamianBangladeshiBarbadianBasqueBelgianBelizeanBermudanBhutaneseBlackfeetBolivianBrazilianBritishBritish West IndianBulgarianBurmeseCajunCambodianCanadianCape VerdeanCarpatho RusynCelticCentral AmericanCentral American IndianCherokeeCheyenneChickasawChileanChineseChippewaChoctawColombianColvilleComancheCosta RicanCreeCreekCroatianCrowCubanCypriotCzechCzechoslovakianDanishDelawareDominicanDutchDutch West IndianEastern EuropeanEcuadorianEgyptianEnglishEstonianEthiopianEuropeanFijianFilipinoFinnishFrenchFrench American IndianFrench CanadianGermanGerman RussianGhanaianGreekGuamanian/ChamorroGuatemalanGuyaneseHaitianHmongHonduranHopiHoumaHungarianIcelanderIndian (Asian)IndonesianInupiatIranianIraqiIrishIroquoisIsraeliItalianJamaicanJapaneseJordanianKenyanKiowaKoreanLaotianLatvianLebaneseLiberianLithuanianLumbeeLuxembourgerMacedonianMalaysianMalteseMarshalleseMenomineeMexicanMexican American IndianMongolianMoroccanNative HawaiianNavajoNepaleseNew ZealanderNicaraguanNigerianNorthern EuropeanNorwegianOkinawanOsageOttawaPaiutePakistaniPalestinianPanamanianParaguayanPennsylvania GermanPeruvianPimaPolishPortuguesePotawatomiPuebloPuerto RicanPuget Sound SalishRomanianRussianSalvadoranSamoanScandinavianScotch-IrishScottishSeminoleSenegaleseSerbianShoshoneSierra LeoneanSiouxSlavicSlovakSloveneSomaliSouth AfricanSouth AmericanSouth American IndianSoviet UnionSpaniardSpanishSpanish AmericanSpanish American IndianSri LankanSubsaharan AfricanSudaneseSwedishSwissSyrianTaiwaneseThaiTlingit-HaidaTohono O'OdhamTonganTrinidadian and TobagonianTsimshianTurkishU.S. Virgin IslanderUgandanUkrainianUruguayanUteVenezuelanVietnameseWelshWest IndianYakamaYaquiYugoslavianYumanYup'ikZimbabwean
Immigration
NonimmigrantsImmigrantsAfghanistanAfricaAlbaniaArgentinaArmeniaAsiaAustraliaAustriaBahamasBangladeshBarbadosBelarusBelgiumBelizeBoliviaBosnia and HerzegovinaBrazilBulgariaBurma/MyanmarCabo VerdeCambodiaCameroonCanadaCaribbeanCentral AmericaChileChinaColombiaCongoCosta RicaCroatiaCubaCzechoslovakiaDenmarkDominicaDominican RepublicEastern AfricaEastern AsiaEastern EuropeEcuadorEgyptEl SalvadorEnglandEritreaEthiopiaEuropeFijiFranceGermanyGhanaGreeceGrenadaGuatemalaGuyanaHaitiHondurasHong KongHungaryIndiaIndonesiaIranIraqIrelandIsraelItalyJamaicaJapanJordanKazakhstanKenyaKoreaKuwaitLaosLatin AmericaLatviaLebanonLiberiaLithuaniaMalaysiaMexicoMicronesiaMiddle AfricaMoldovaMoroccoNepalNetherlandsNicaraguaNigeriaNorth AmericaNorth MacedoniaNorthern AfricaNorthern EuropeNorwayOceaniaPakistanPanamaPeruPhilippinesPolandPortugalRomaniaRussiaSaudi ArabiaScotlandSenegalSerbiaSierra LeoneSingaporeSomaliaSouth AfricaSouth AmericaSouth Central AsiaSouth Eastern AsiaSouthern EuropeSpainSri LankaSudanSwedenSwitzerlandSyriaTaiwanThailandTrinidad and TobagoTurkeyUgandaUkraineUruguayUzbekistanVenezuelaVietnamWest IndiesWestern AfricaWestern AsiaWestern EuropeYemenZaireZimbabweAzores
Immigrants from St. Vincent and the Grenadines
Race
Ancestry
AfghanAfricanAlaska NativeAlaskan AthabascanAlbanianAleutAlsatianAmericanApacheArabArapahoArgentineanArmenianAssyrian/Chaldean/SyriacAustralianAustrianBahamianBangladeshiBarbadianBasqueBelgianBelizeanBermudanBhutaneseBlackfeetBolivianBrazilianBritishBritish West IndianBulgarianBurmeseCajunCambodianCanadianCape VerdeanCarpatho RusynCelticCentral AmericanCentral American IndianCherokeeCheyenneChickasawChileanChineseChippewaChoctawColombianColvilleComancheCosta RicanCreeCreekCroatianCrowCubanCypriotCzechCzechoslovakianDanishDelawareDominicanDutchDutch West IndianEastern EuropeanEcuadorianEgyptianEnglishEstonianEthiopianEuropeanFijianFilipinoFinnishFrenchFrench American IndianFrench CanadianGermanGerman RussianGhanaianGreekGuamanian/ChamorroGuatemalanGuyaneseHaitianHmongHonduranHopiHoumaHungarianIcelanderIndian (Asian)IndonesianInupiatIranianIraqiIrishIroquoisIsraeliItalianJamaicanJapaneseJordanianKenyanKiowaKoreanLaotianLatvianLebaneseLiberianLithuanianLumbeeLuxembourgerMacedonianMalaysianMalteseMarshalleseMenomineeMexicanMexican American IndianMongolianMoroccanNative HawaiianNavajoNepaleseNew ZealanderNicaraguanNigerianNorthern EuropeanNorwegianOkinawanOsageOttawaPaiutePakistaniPalestinianPanamanianParaguayanPennsylvania GermanPeruvianPimaPolishPortuguesePotawatomiPuebloPuerto RicanPuget Sound SalishRomanianRussianSalvadoranSamoanScandinavianScotch-IrishScottishSeminoleSenegaleseSerbianShoshoneSierra LeoneanSiouxSlavicSlovakSloveneSomaliSouth AfricanSouth AmericanSouth American IndianSoviet UnionSpaniardSpanishSpanish AmericanSpanish American IndianSri LankanSubsaharan AfricanSudaneseSwedishSwissSyrianTaiwaneseThaiTlingit-HaidaTohono O'OdhamTonganTrinidadian and TobagonianTsimshianTurkishU.S. Virgin IslanderUgandanUkrainianUruguayanUteVenezuelanVietnameseWelshWest IndianYakamaYaquiYugoslavianYumanYup'ikZimbabwean
Immigration
NonimmigrantsImmigrantsAfghanistanAfricaAlbaniaArgentinaArmeniaAsiaAustraliaAustriaBahamasBangladeshBarbadosBelarusBelgiumBelizeBoliviaBosnia and HerzegovinaBrazilBulgariaBurma/MyanmarCabo VerdeCambodiaCameroonCanadaCaribbeanCentral AmericaChileChinaColombiaCongoCosta RicaCroatiaCubaCzechoslovakiaDenmarkDominicaDominican RepublicEastern AfricaEastern AsiaEastern EuropeEcuadorEgyptEl SalvadorEnglandEritreaEthiopiaEuropeFranceGermanyGhanaGreeceGrenadaGuatemalaGuyanaHaitiHondurasHong KongHungaryIndiaIndonesiaIranIraqIrelandIsraelItalyJamaicaJapanJordanKazakhstanKenyaKoreaKuwaitLaosLatin AmericaLatviaLebanonLiberiaLithuaniaMalaysiaMexicoMicronesiaMiddle AfricaMoldovaMoroccoNepalNetherlandsNicaraguaNigeriaNorth AmericaNorth MacedoniaNorthern AfricaNorthern EuropeNorwayOceaniaPakistanPanamaPeruPhilippinesPolandPortugalRomaniaRussiaSaudi ArabiaScotlandSenegalSerbiaSierra LeoneSingaporeSomaliaSouth AfricaSouth AmericaSouth Central AsiaSouth Eastern AsiaSouthern EuropeSpainSri LankaSt. Vincent and the GrenadinesSudanSwedenSwitzerlandSyriaTaiwanThailandTrinidad and TobagoTurkeyUgandaUkraineUruguayUzbekistanVenezuelaVietnamWest IndiesWestern AfricaWestern AsiaWestern EuropeYemenZaireZimbabweAzores
Divorced or Separated
Income
Poverty
Unemployment
Labor Participation
Family Structure
Vehicle Availability
Education Level
Disability

Divorced or Separated Comparison

Immigrants from Fiji

Immigrants from St. Vincent and the Grenadines

Exceptional
Excellent
11.6%
DIVORCED OR SEPARATED
98.9/ 100
METRIC RATING
94th/ 347
METRIC RANK
11.8%
DIVORCED OR SEPARATED
88.4/ 100
METRIC RATING
129th/ 347
METRIC RANK

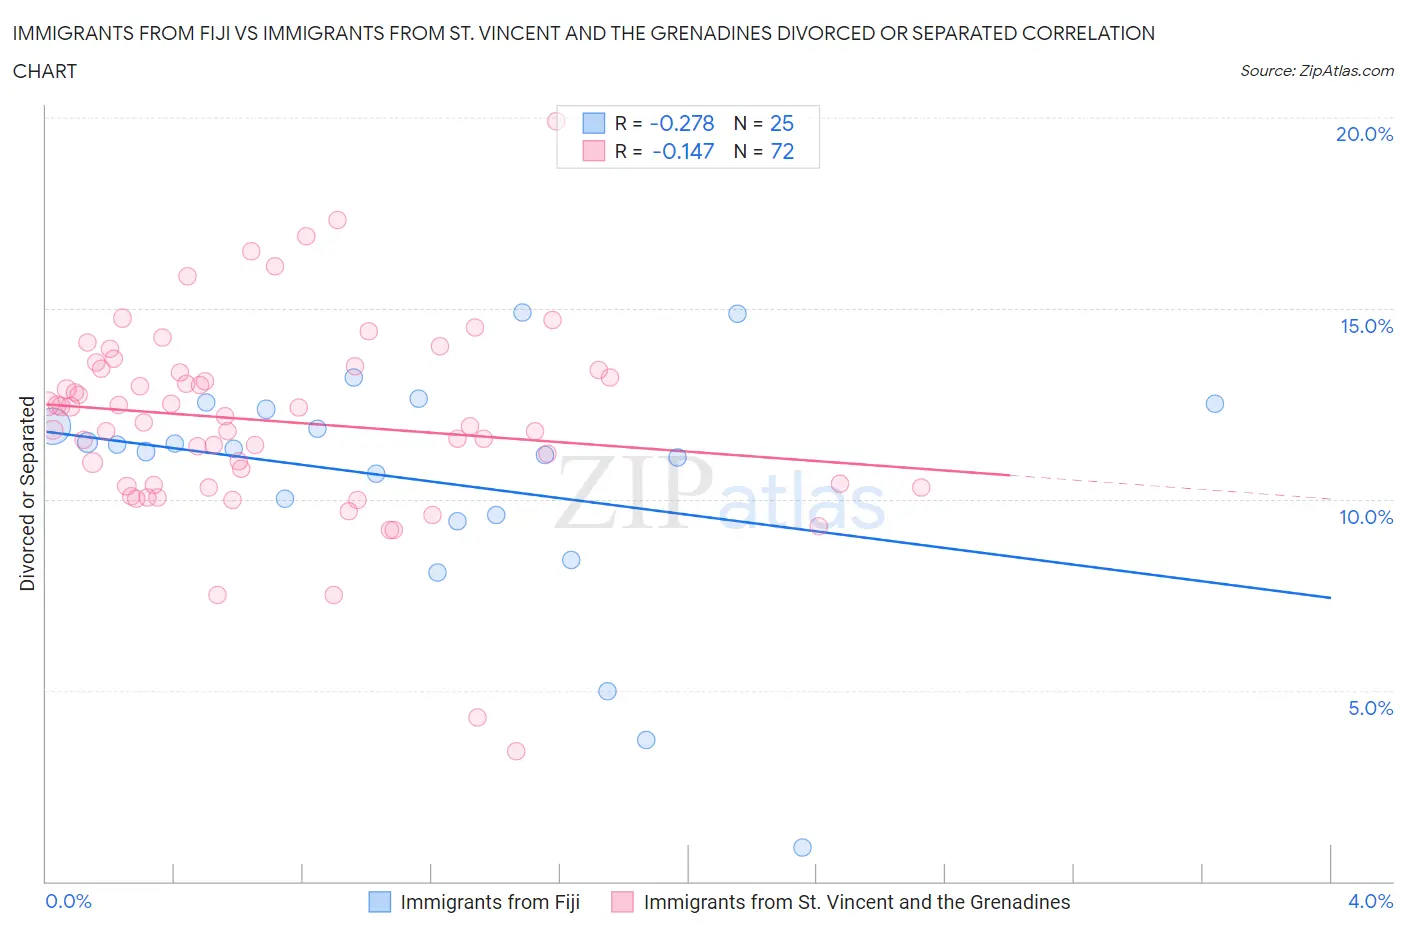
Immigrants from Fiji vs Immigrants from St. Vincent and the Grenadines Divorced or Separated Correlation Chart

The statistical analysis conducted on geographies consisting of 93,755,407 people shows a weak negative correlation between the proportion of Immigrants from Fiji and percentage of population currently divorced or separated in the United States with a correlation coefficient (R) of -0.278 and weighted average of 11.6%. Similarly, the statistical analysis conducted on geographies consisting of 56,190,890 people shows a poor negative correlation between the proportion of Immigrants from St. Vincent and the Grenadines and percentage of population currently divorced or separated in the United States with a correlation coefficient (R) of -0.147 and weighted average of 11.8%, a difference of 2.2%.
Immigrants from Fiji vs Immigrants from St. Vincent and the Grenadines Divorced or Separated

Divorced or Separated Correlation Summary

MeasurementImmigrants from FijiImmigrants from St. Vincent and the Grenadines
Minimum0.90%3.4%
Maximum14.9%19.9%
Range14.0%16.5%
Mean10.5%12.0%
Median11.3%12.1%
Interquartile 25% (IQ1)9.5%10.4%
Interquartile 75% (IQ3)12.4%13.4%
Interquartile Range (IQR)2.9%3.0%
Standard Deviation (Sample)3.2%2.6%
Standard Deviation (Population)3.2%2.6%

Similar Demographics by Divorced or Separated

Demographics Similar to Immigrants from Fiji by Divorced or Separated

In terms of divorced or separated, the demographic groups most similar to Immigrants from Fiji are Immigrants from Denmark (11.6%, a difference of 0.010%), Arab (11.6%, a difference of 0.010%), Spanish American Indian (11.6%, a difference of 0.070%), Immigrants from Serbia (11.6%, a difference of 0.10%), and Zimbabwean (11.6%, a difference of 0.11%).
DemographicsRating | RankDivorced or Separated
Immigrants | Nepal
99.2
/100
|
#87
Exceptional
11.6%
Immigrants | Europe
99.2
/100
|
#88
Exceptional
11.6%
Immigrants | Southern Europe
99.1
/100
|
#89
Exceptional
11.6%
Zimbabweans
99.0
/100
|
#90
Exceptional
11.6%
Spanish American Indians
99.0
/100
|
#91
Exceptional
11.6%
Immigrants | Denmark
98.9
/100
|
#92
Exceptional
11.6%
Arabs
98.9
/100
|
#93
Exceptional
11.6%
Immigrants | Fiji
98.9
/100
|
#94
Exceptional
11.6%
Immigrants | Serbia
98.8
/100
|
#95
Exceptional
11.6%
Immigrants | Ukraine
98.7
/100
|
#96
Exceptional
11.6%
Latvians
98.7
/100
|
#97
Exceptional
11.6%
Immigrants | Jordan
98.6
/100
|
#98
Exceptional
11.6%
Immigrants | Sweden
98.6
/100
|
#99
Exceptional
11.6%
Immigrants | Northern Europe
98.6
/100
|
#100
Exceptional
11.6%
Immigrants | Guyana
98.5
/100
|
#101
Exceptional
11.6%

Demographics Similar to Immigrants from St. Vincent and the Grenadines by Divorced or Separated

In terms of divorced or separated, the demographic groups most similar to Immigrants from St. Vincent and the Grenadines are Immigrants from Austria (11.8%, a difference of 0.010%), Immigrants from Cambodia (11.8%, a difference of 0.020%), South African (11.8%, a difference of 0.040%), Immigrants from Ecuador (11.8%, a difference of 0.040%), and Immigrants from Afghanistan (11.8%, a difference of 0.040%).
DemographicsRating | RankDivorced or Separated
Menominee
93.8
/100
|
#122
Exceptional
11.8%
Immigrants | Immigrants
93.7
/100
|
#123
Exceptional
11.8%
Ugandans
93.1
/100
|
#124
Exceptional
11.8%
Ukrainians
92.3
/100
|
#125
Exceptional
11.8%
South American Indians
92.1
/100
|
#126
Exceptional
11.8%
South Africans
88.9
/100
|
#127
Excellent
11.8%
Immigrants | Ecuador
88.9
/100
|
#128
Excellent
11.8%
Immigrants | St. Vincent and the Grenadines
88.4
/100
|
#129
Excellent
11.8%
Immigrants | Austria
88.2
/100
|
#130
Excellent
11.8%
Immigrants | Cambodia
88.2
/100
|
#131
Excellent
11.8%
Immigrants | Afghanistan
87.9
/100
|
#132
Excellent
11.8%
New Zealanders
87.5
/100
|
#133
Excellent
11.9%
Argentineans
85.1
/100
|
#134
Excellent
11.9%
Danes
84.8
/100
|
#135
Excellent
11.9%
Carpatho Rusyns
84.8
/100
|
#136
Excellent
11.9%